
Financial modeling is a vital process for entrepreneurs and developers seeking to predict future performance, understand economic viability, and obtain funding for their apps. You can project revenues, costs, and key performance indicators (KPIs) with a robust financial model. With our guide, you’ll learn how to build a mobile app financial model. So, you will be able to build a financial model for mobile apps, including Daily Active Users (DAUs), Monthly Active Users (MAUs), ARRs, CACs, and ARPUs.
We have also built a Mobile App Financial Model Template for Founders and Entrepreneurs to use. Simply input your assumptions into our model and it will do everything for you!
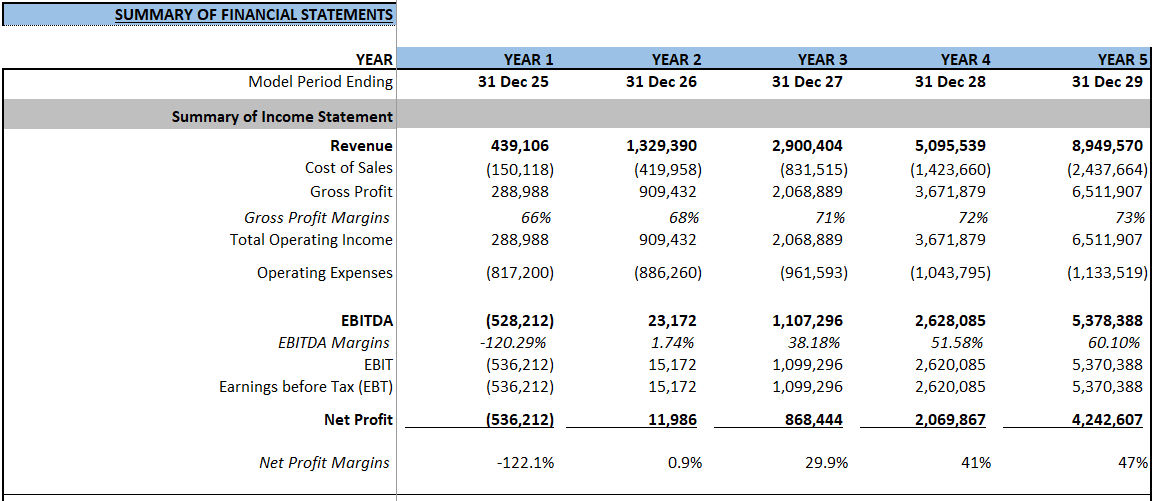
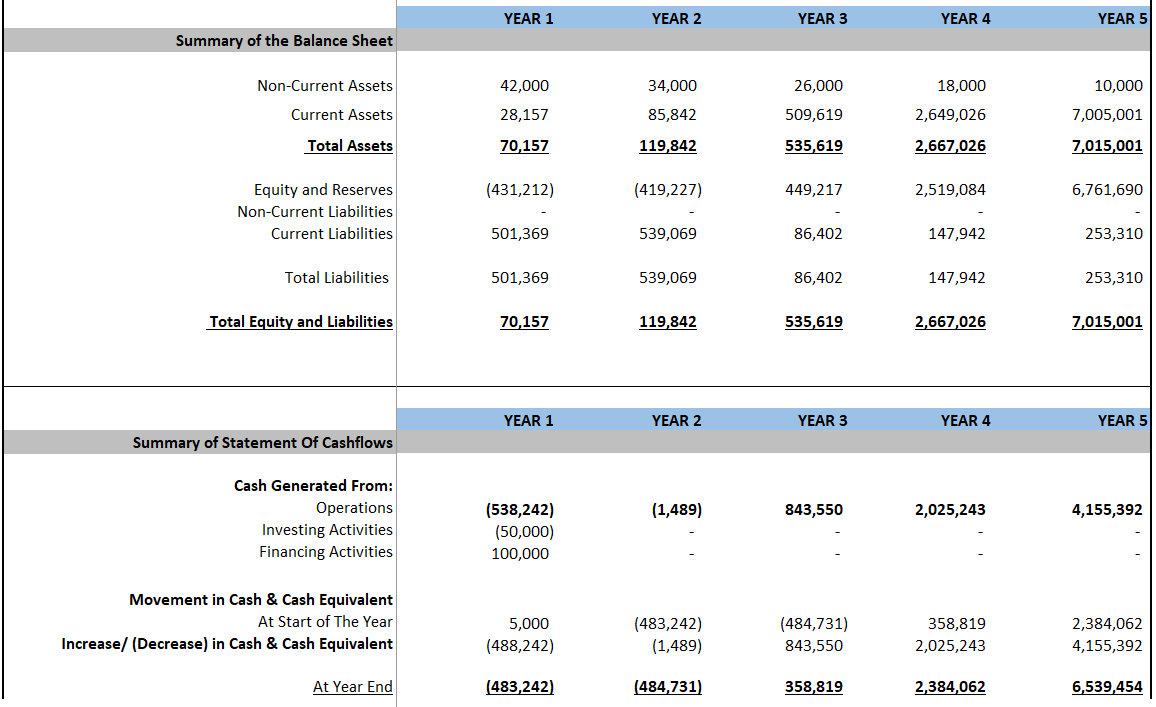
This is a complete 3-way financial model with an income statement, balance sheet, cash flow statement, metrics and ratios specific to mobile apps, and a valuation page. We also have 5 different types of Mobile App models (E-Commerce, Games, Healthcare, Social Media and Travel Mobile App Financial Models).
What is a Mobile App Financial Model?
The financial model of your mobile app shows how your app performs over a defined period of time. This model includes
- Revenue forecasts
- Cost estimates
- and various performance metrics to help you evaluate your app’s potential.
Key Components of a Mobile App Financial Model
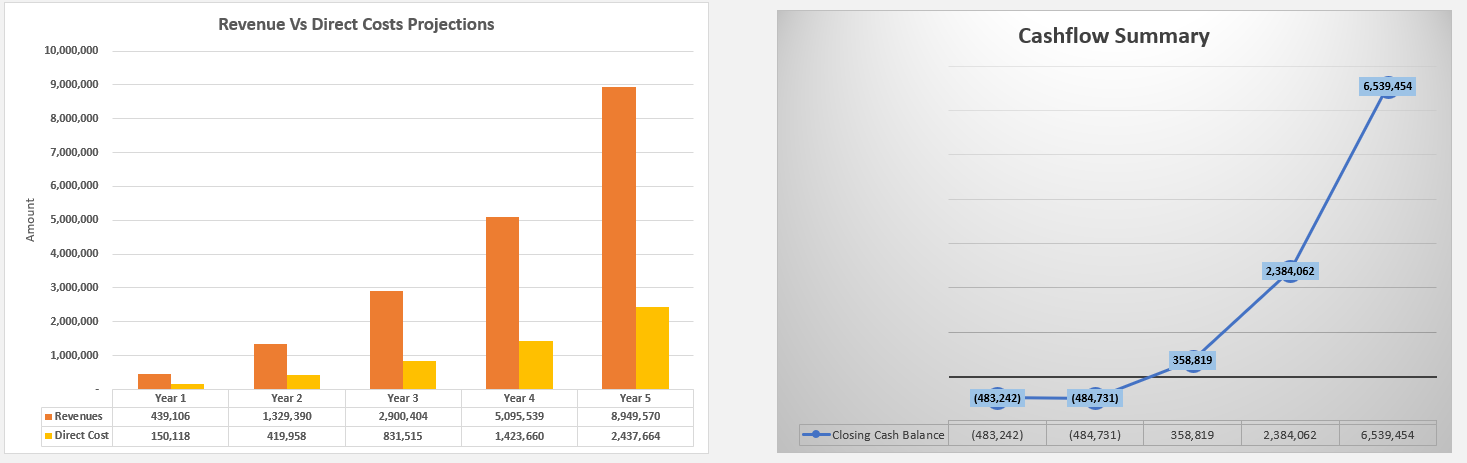
- Revenue Projections: Estimates of income from app sales, subscriptions, in-app purchases, or advertising.
- Cost Structure: Direct and indirect costs associated with app development and maintenance.
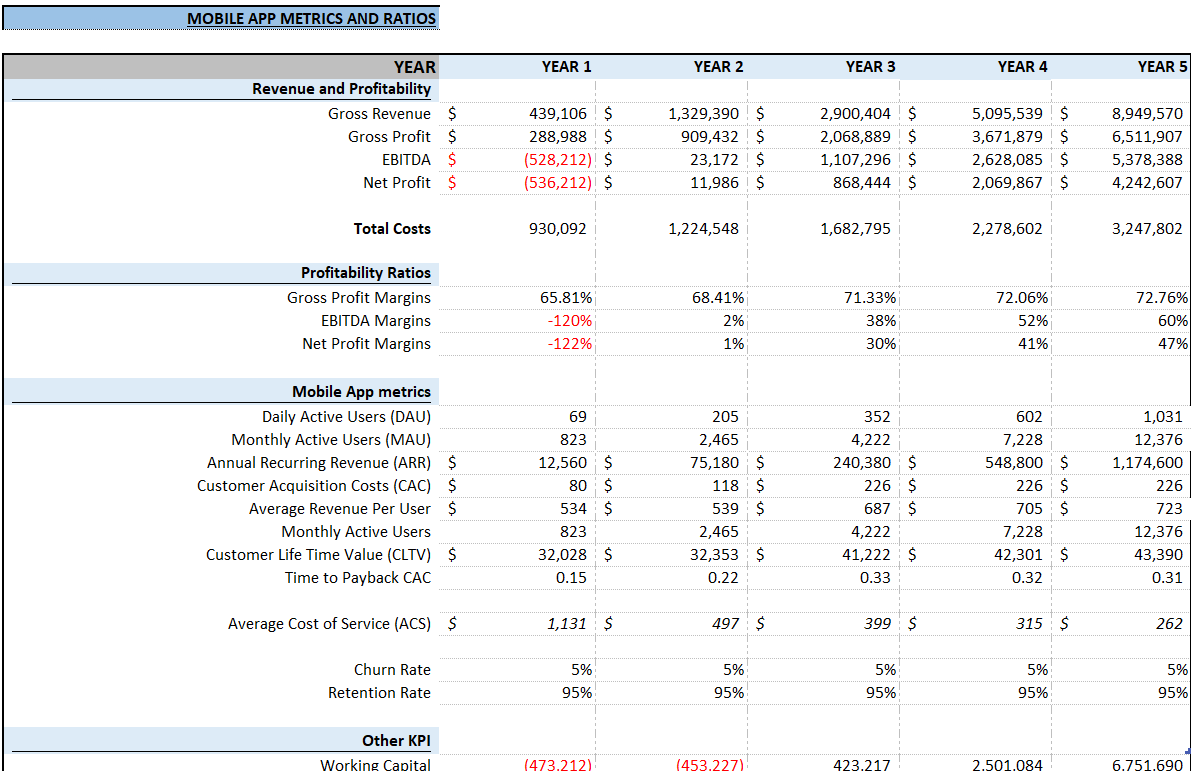
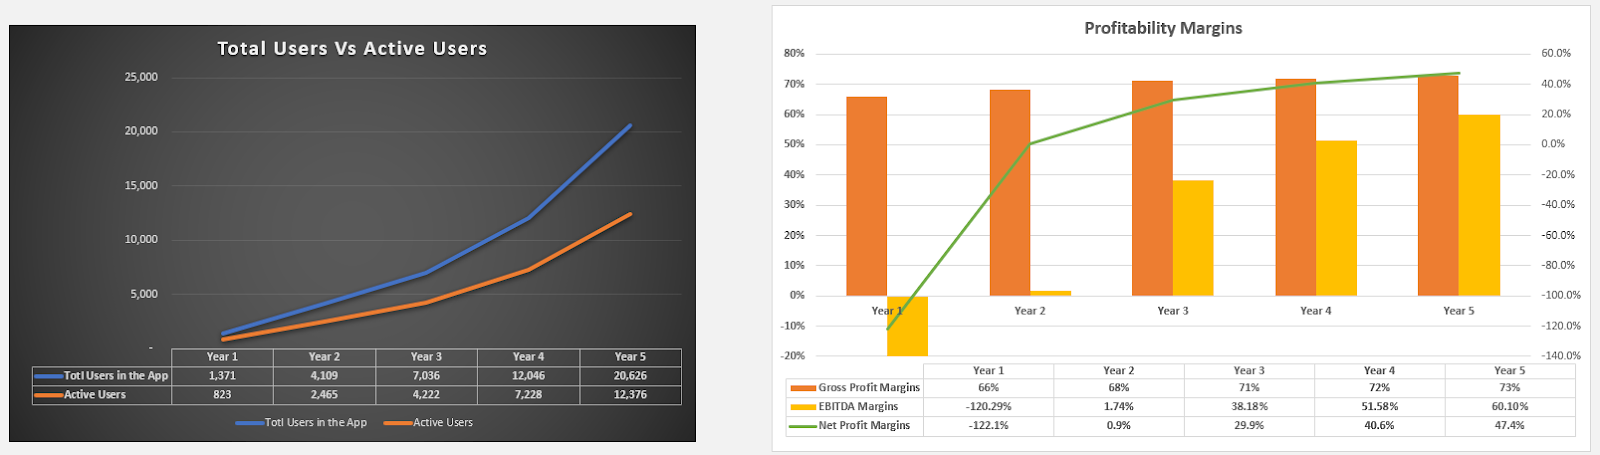
- Key Performance Indicators (KPIs): Metrics such as DAUs, MAUs, ARR, CAC, and ARPU that help measure the app’s success.
- Cash Flow Analysis: Assessment of cash inflows and outflows over time.
- Break-even Analysis: Understanding when your app will become profitable.
Important Metrics to Include
- Daily Active Users (DAUs): The number of unique users who engage with your app daily.
- Monthly Active Users (MAUs): The number of unique users who engage with your app monthly.
- Annual Recurring Revenue (ARR): Predictable revenue generated annually, particularly important for subscription-based apps.
- Customer Acquisition Cost (CAC): The cost associated with acquiring a new user.
- Average Revenue Per User (ARPU): The average revenue generated per user, calculated by dividing total revenue by the number of users.
How to Build a Mobile App Financial Model?
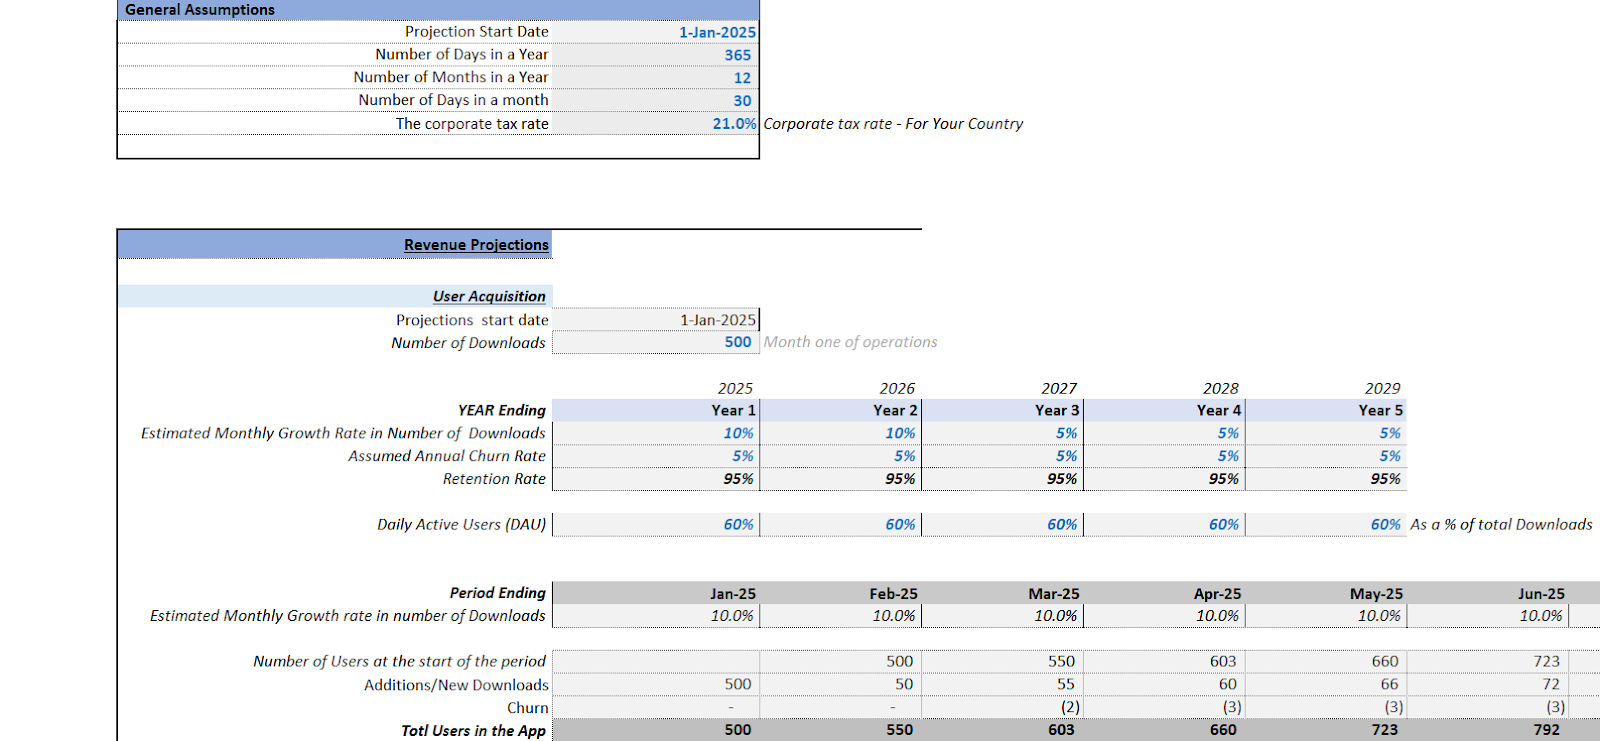
Step 1: Define Your Assumptions
Start by outlining the key assumptions that will drive your financial model. These should include:
- Target DAUs and MAUs: Estimated number of daily and monthly active users.
- Pricing Model: Revenue generated from subscriptions, in-app purchases, or advertising.
- User Growth Rate: Projected growth rate of your user base.
- CAC: Expected cost of acquiring new users.
- Churn Rate: The rate at which users stop using your app.
Example Assumptions
- Target DAUs: 10,000
- Target MAUs: 100,000
- Subscription Price: $10/month
- User Growth Rate: 5% per month
- CAC: $5
- Churn Rate: 5% per month
Step 2: Structure Your Model
Organize your financial model in a spreadsheet for clarity and ease of use. Common sections to include are:
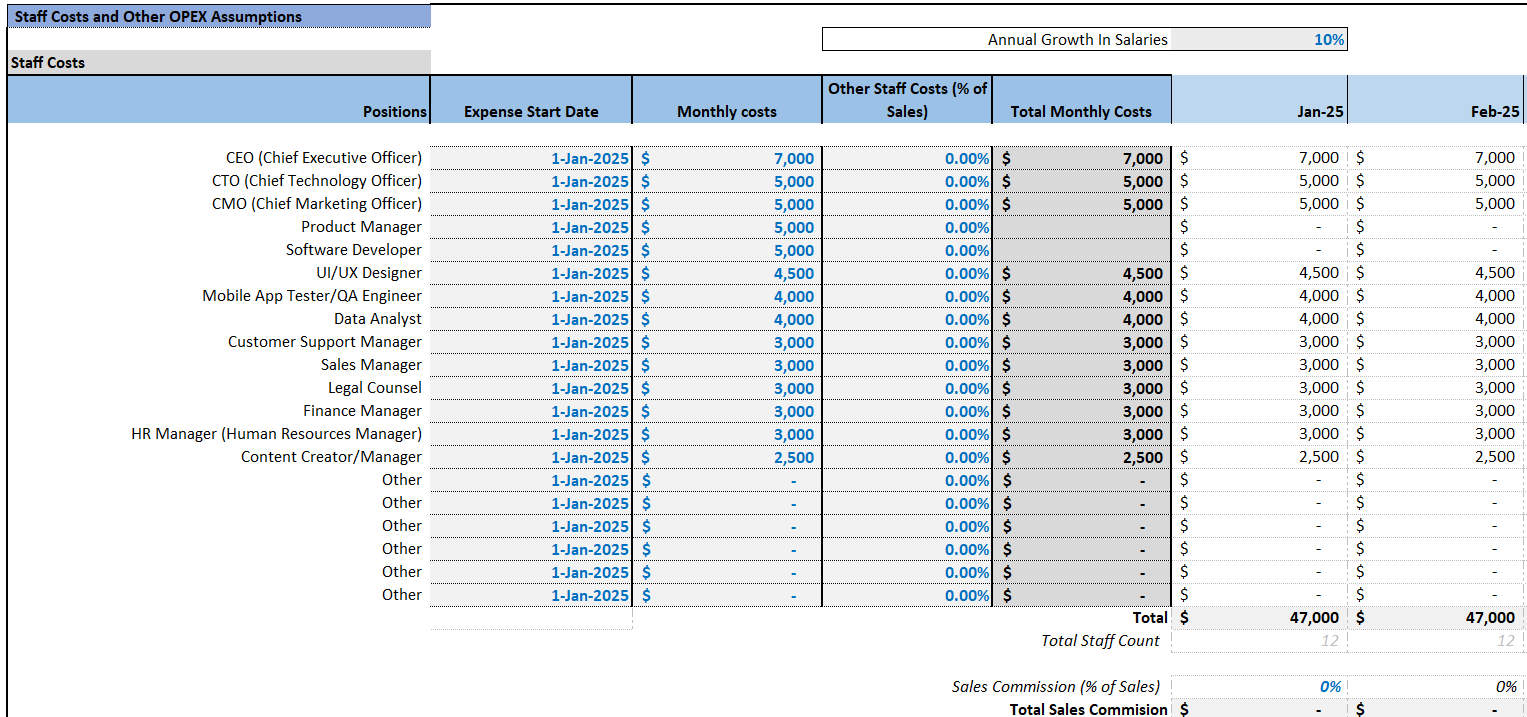
- Input Assumptions: A dedicated section for all key metrics.
- Revenue Projections: Detailed forecasts of app revenue.
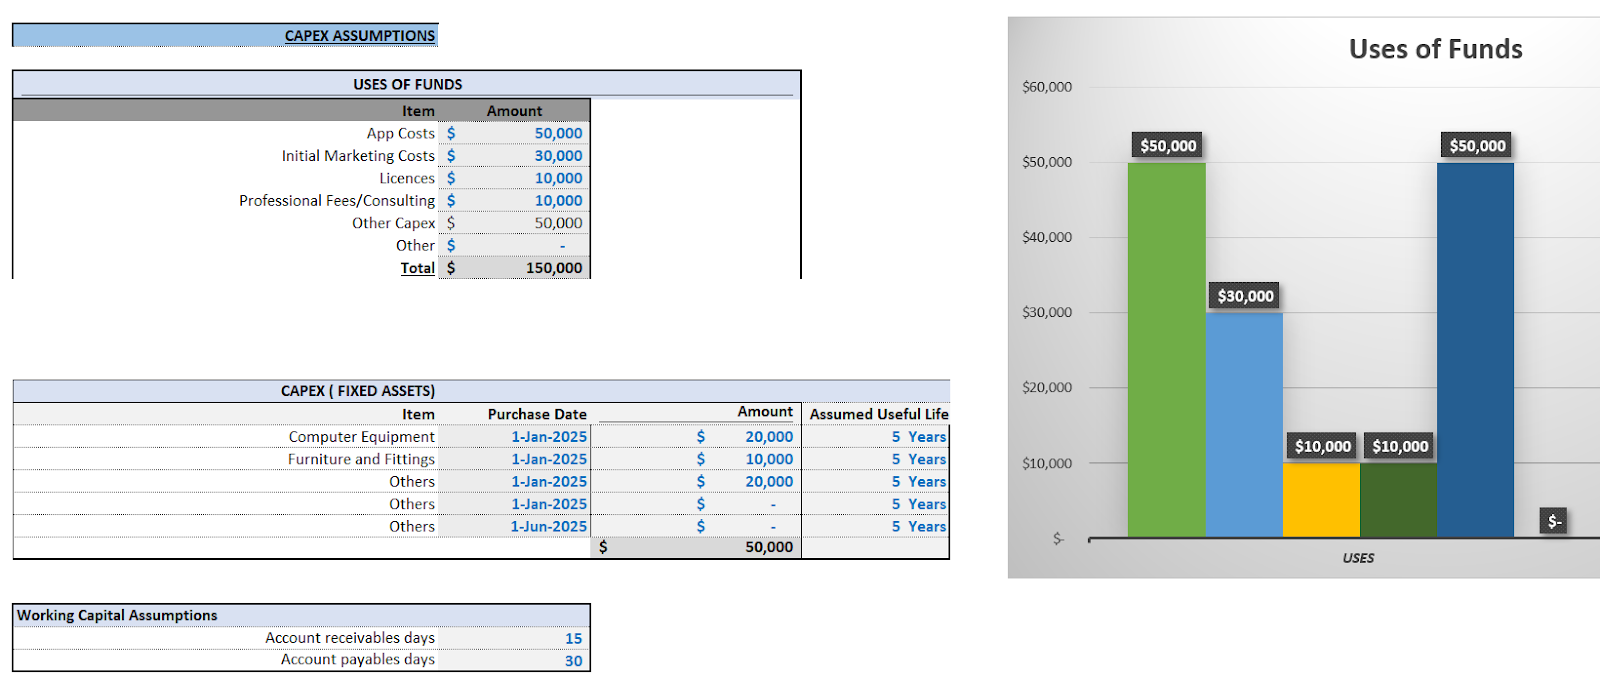
- Cost Projections: Estimates of user acquisition costs and operating expenses.
- Cash Flow Statement: Summary of cash inflows and outflows.
- Key Performance Metrics: Summary of important financial ratios and metrics.
Step 3: Create the Input Assumptions Sheet
Create an input assumptions sheet with all key metrics clearly defined. You can update and adjust assumptions without affecting the overall structure of your model by using this sheet.
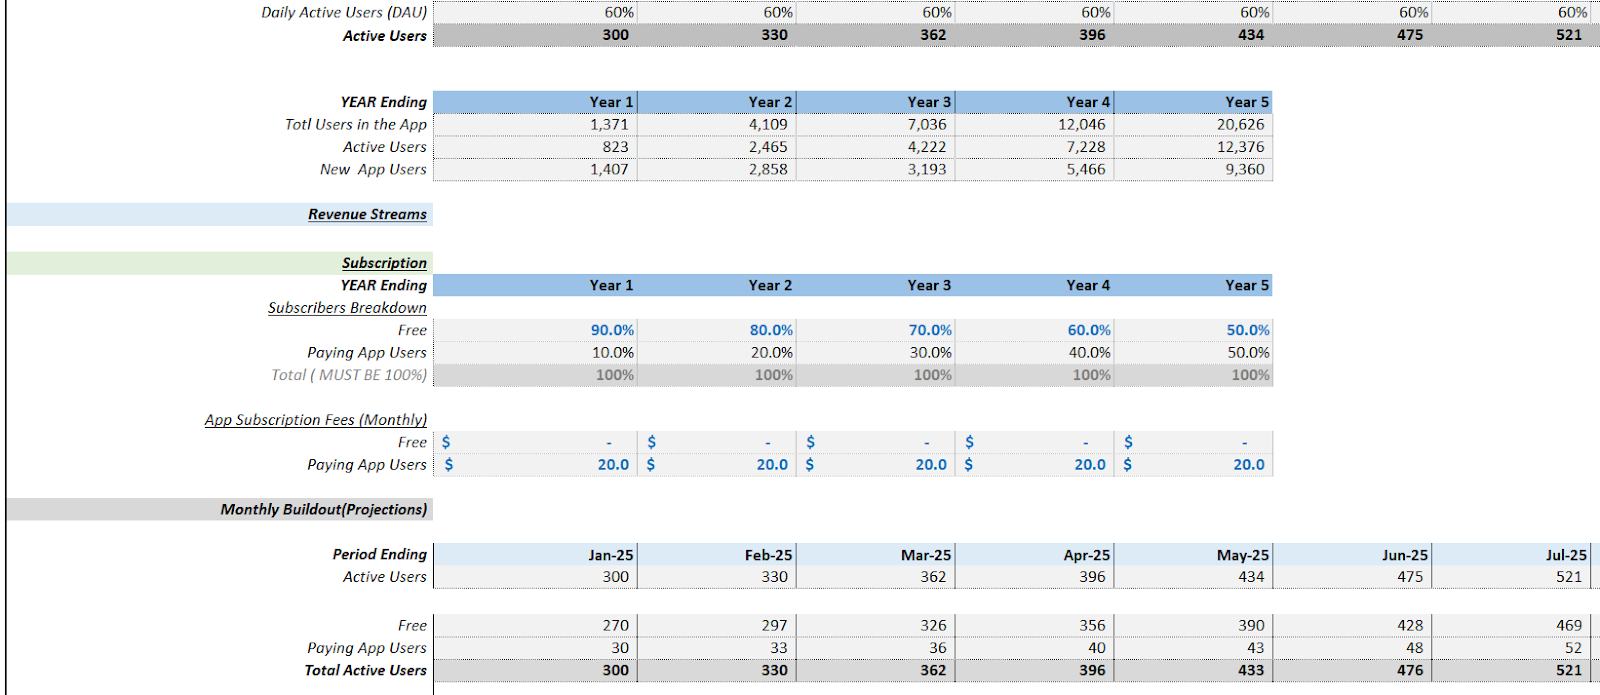
Step 4: Calculate Revenue Projections
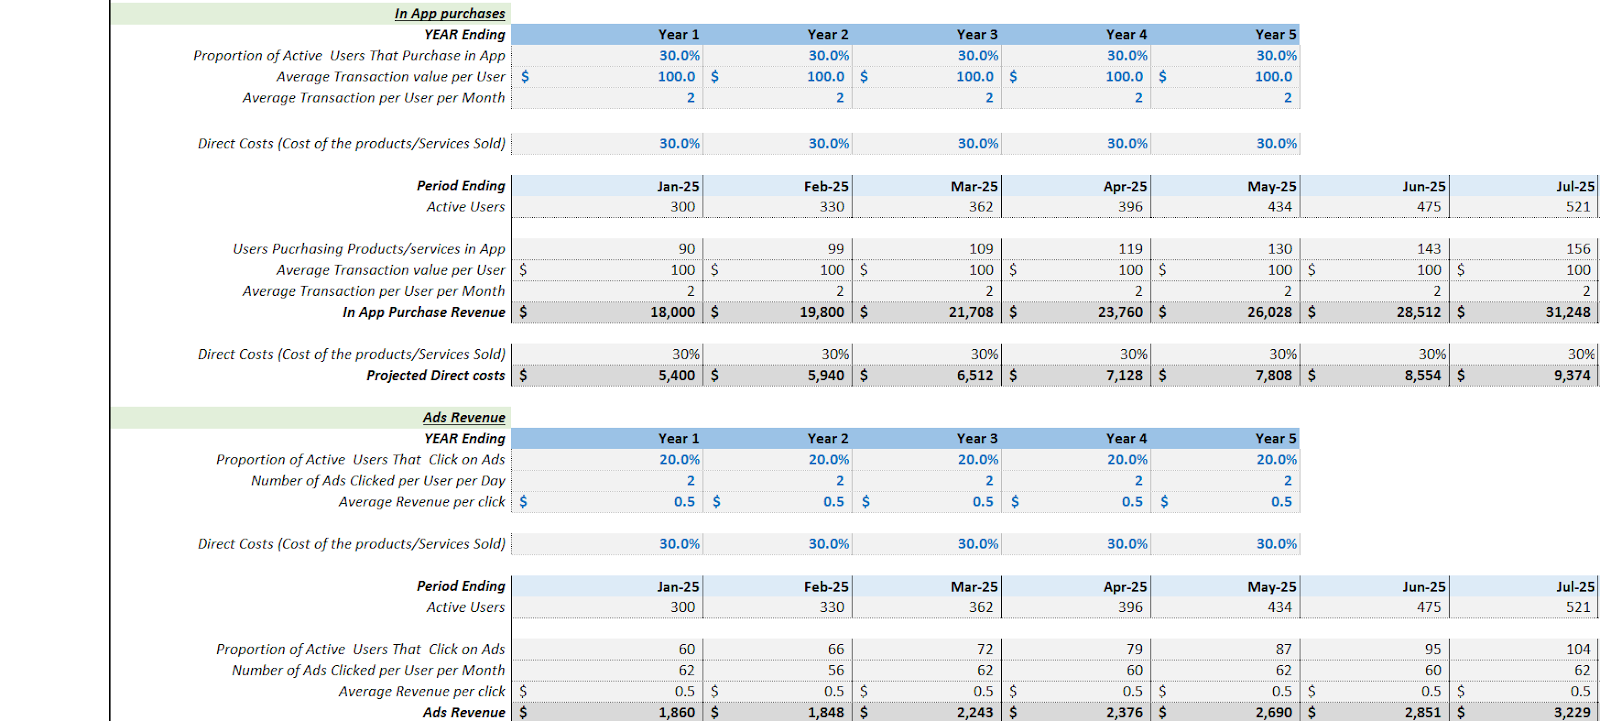
To forecast your revenue, consider the primary sources of income for your app. This could include subscriptions, in-app purchases, or advertising.
For simplicity, let’s focus on a subscription-based model:
Revenue from Subscriptions: Monthly Revenue = MAUs × Subscription Price × (1−Churn Rate)
Example Calculation
Assuming you start with 10,000 MAUs and a subscription price of $10/month:
Monthly Revenue = 10,000 × 10 × (1−0.05) = 10,000 × 10 × 0.95 = $95,000
Step 5: Calculate Annual Recurring Revenue (ARR)
ARR is particularly important for subscription models, as it provides a clear picture of predictable revenue. Calculate it using:
ARR = Monthly Revenue × 12
Example Calculation
Continuing from our monthly revenue calculation:
ARR = 95,000 × 12 = $1,140,000
Step 6: Estimate Customer Acquisition Costs (CAC)
CAC is a crucial metric that tells you how much you need to spend to acquire each new user. To calculate it, divide your total marketing expenses by the number of new users acquired.
CAC = Total Marketing Expenses / New Users Acquired
Example Calculation
If your marketing expenses are $50,000 in a month and you acquire 10,000 new users:
CAC = 50,000 / 10,000 = $5
Step 7: Analyze User Growth and Churn Rate
Understanding user growth and churn is vital for forecasting future revenue. Use your growth rate and churn rate to project your user base over time.
- New Users: New Users = MAUs × Growth Rate
- Churned Users: Churned Users = MAUs × Churn Rate
Example Calculation
Assuming a growth rate of 5% and a churn rate of 5%:
- New Users:
New Users = 100,000 × 0.05 =5,000
- Churned Users:
Churned Users = 100,000 × 0.05 = 5,000
Step 8: Calculate Average Revenue Per User (ARPU)
ARPU gives insights into how much revenue each user contributes on average. It’s calculated as follows:
ARPU = Total Revenue / Total Users
Example Calculation
If your total revenue is $1,140,000 and you have 100,000 users:
ARPU = 1,140,000 / 100,000 = $11.40
Step 9: Create a Cash Flow Statement
The cash flow statement summarizes all cash inflows and outflows over time. Organize it into sections:
- Cash Inflows: Include total revenue from subscriptions or in-app purchases.
- Cash Outflows: Include operating expenses, marketing costs, and any other costs.

Example Cash Flow Summary
| Month | Cash Inflows | Cash Outflows | Net Cash Flow |
|---|---|---|---|
| 1 | $95,000 | $50,000 (CAC) + $20,000 (OpEx) = $70,000 | $25,000 |
| 2 | $95,000 | $50,000 | $45,000 |
| 3 | $95,000 | $50,000 | $45,000 |
Step 10: Conduct Break-even Analysis
Understanding when your app will break even is crucial for long-term planning. The break-even point occurs when total revenue equals total costs.
To find the break-even point, use the formula:
Break-even Point (in months) = Total Fixed Costs / (Monthly Revenue − Variable Costs)
Example Calculation
Assuming total fixed costs of $100,000 and a monthly revenue of $95,000 with variable costs of $50,000:
Break-even Point = 100,000 / (95,000−50,000) ≈ 2.22 months
Step 11: Calculate Key Performance Indicators (KPIs)
To evaluate your app’s performance, calculate essential KPIs such as:
- Monthly Active Users (MAUs):
MAUs = DAUs × Average Days in Month
- Churn Rate:
Churn Rate = Churned Users / Total Users ×100
- Lifetime Value (LTV):
LTV = ARPU / Churn Rate
Example KPI Calculation
If your ARPU is $11.40 and your churn rate is 5%:
LTV = 11.40 /0.05 = $228
Step 12: Perform Sensitivity Analysis
Conduct sensitivity analysis to understand how changes in key assumptions affect your financial projections. Test various scenarios, such as:
- A higher or lower user growth rate.
- Changes in CAC or churn rates.
- Variations in subscription pricing.
Step 13: Review and Refine Your Model
Once your initial model is complete, review it for accuracy and logical flow. Ensure that all calculations are correct and that inputs are clearly defined. Seek feedback from industry peers or financial advisors to identify areas for improvement.
Step 14: Use the Model for Decision-Making
Now that you have a comprehensive financial model, leverage it for decision-making. You can use your model to determine new features, adjust pricing strategies, or plan marketing campaigns.
Example Scenarios for Decision-Making
- New Features: Estimate the financial impact of adding a new feature to your app.
- Pricing Strategies: Analyze how changing the subscription price might affect user acquisition and revenue.
- Marketing Campaigns: Evaluate the ROI of different marketing strategies based on projected CAC and user growth.
Final Thoughts!
Hope you got a complete idea about how to build a Mobile App Financial Model. Building a financial model for your mobile app is key to understanding its potential and sustainability. Start by defining assumptions, structuring your model, calculating revenues and costs, and analyzing key metrics. Over time, refine your model with advanced techniques and real performance data to improve accuracy and guide decisions. With practice, you’ll confidently navigate the world of app finance.
If you are looking for a ready-to-go Mobile App Financial Model Template then we’ve done the hard work for you! You can find the link here. This is perfect for any Founder to use to model out their Clinic with specific Clinic metrics included in the template too.
Here are some excellent articles you may find useful: Metrics for mobile apps: The important ones to track in 2024, Top 51 Important Mobile App KPIs to Measure Performance 2024 and How to Prepare a Financial Plan for your Mobile App Idea?.