
Creating a financial model for your restaurant is crucial for assessing its financial health and forecasting future performance. A solid financial model enables restaurant owners to evaluate profitability, manage cash flow, and attract potential investors or lenders. How to build a restaurant financial model? With this guide, you can develop a comprehensive restaurant financial model. We have focused on key metrics such as Average Cover, Revenue Per Available Seat Hour (RevPASH), and Table Turnover.
We have also built a Restaurant Financial Model Template for Founders and Entrepreneurs to use. Effortlessly input your assumptions into our complete 3-way Financial Model. It generates an Income Statement, Balance Sheet, Cash Flow Statement, restaurant-specific metrics and ratios, plus a valuation page to determine your business’s worth. We also have over 20 different types of Restaurant models which you can also see here.
What is a Restaurant Financial Model?
A restaurant financial model is a structured framework that outlines a restaurant’s financial performance over three to five years. It encompasses key components such as revenue projections, operating costs, capital expenditures, financing assumptions, and cash flow analyses. The restaurant industry needs this comprehensive model to plan, budget, and make financial decisions.
Key Components of a Restaurant Financial Model

- Revenue Projections: Estimates of income from food, beverages, and other sales.
- Cost of Goods Sold (COGS): Direct costs associated with producing menu items.
- Operating Expenses: Indirect costs, including rent, utilities, and staff salaries.
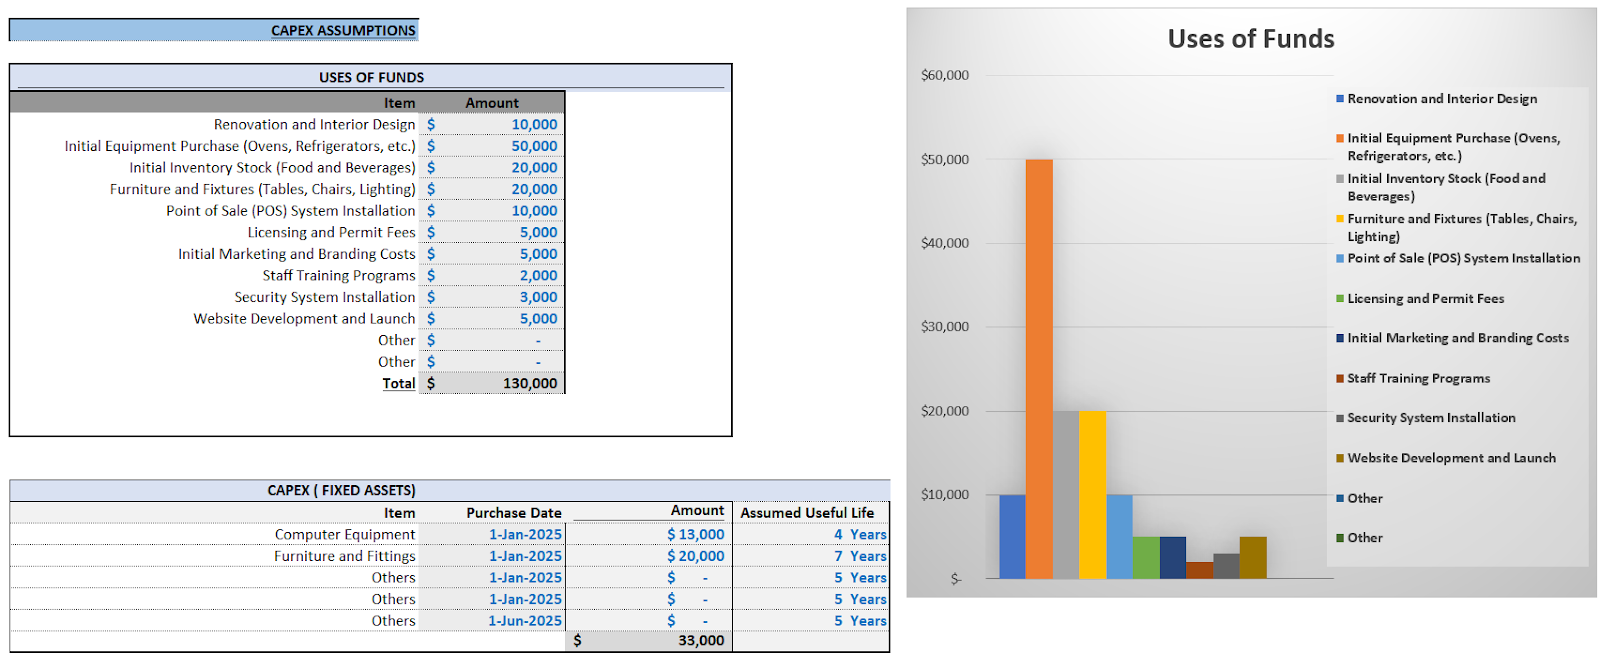
- Capital Expenditures (CapEx): Investments in equipment, renovations, and other long-term assets.
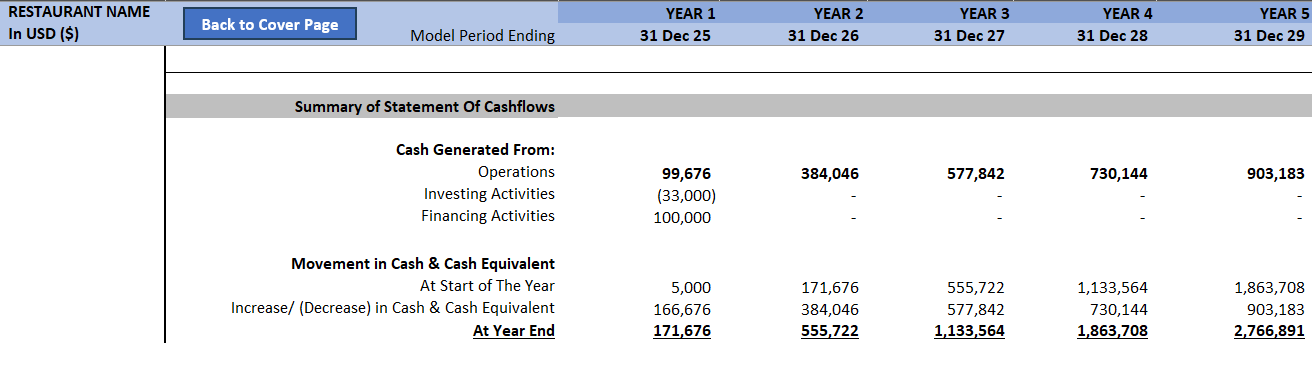
- Cash Flow Analysis: Evaluation of cash inflows and outflows over time.
- Key Performance Indicators (KPIs): Metrics to measure business performance, such as profit margins, labor costs, and sales growth.
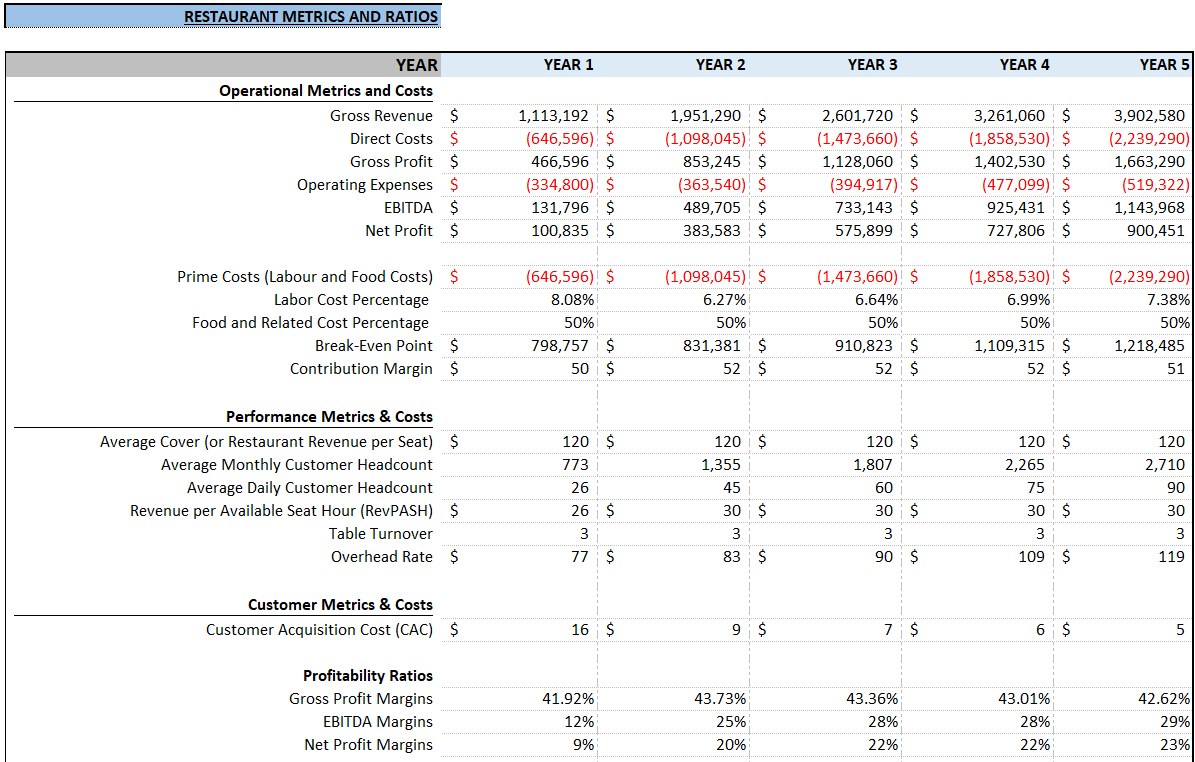
Important Metrics to Include
- Average Cover: The average amount spent per customer per visit.
- Revenue Per Available Seat Hour (RevPASH): A measure of revenue generated per seat per hour, reflecting both sales efficiency and capacity utilization.
- Table Turnover: The number of times a table is occupied and vacated within a specific time period, indicating how well the restaurant utilizes its seating.
- Overhead Rate: A percentage that indicates the relationship between indirect costs and direct costs, useful for budgeting and cost control.
How to Build a Restaurant Financial Model?
Step 1: Define Your Assumptions
Start by outlining the key assumptions that will drive your financial model. These should include:
- Average Check Size (Average Cover): The average amount spent by customers per visit.
- Sales Volume: Estimated number of customers served per day.
- Table Turnover: The expected number of times a table will be occupied during service hours.
- Revenue Per Available Seat Hour (RevPASH): Expected revenue generated per seat per hour.
- Cost of Goods Sold (COGS): Percentage of sales that will be spent on food and beverage costs.
- Operating Expenses: Monthly costs including rent, utilities, and salaries.
- Capital Expenditures: Initial and ongoing investments in equipment and renovations.
Example Assumptions
- Average Check Size: $25.00
- Sales Volume: 100 customers per day
- Table Turnover: 2 times per meal period
- Revenue Per Available Seat Hour (RevPASH): $15.00
- COGS: 30% of sales
- Monthly Operating Expenses: $15,000
- Initial CapEx: $200,000
Step 2: Structure Your Model
Organize your financial model in a spreadsheet for clarity and ease of use. Common sections to include are:
- Input Assumptions: A dedicated section for all key metrics.
- Revenue Projections: Detailed forecasts of sales revenue.
- Cost of Goods Sold (COGS): Calculation of direct costs.
- Operating Expenses: Breakdown of indirect costs.
- Cash Flow Statement: Summary of cash inflows and outflows.
- Key Performance Metrics: Summary of important financial ratios and metrics.
Step 3: Create the Input Assumptions Sheet
Set up an input assumptions sheet in your spreadsheet where all key metrics are clearly defined. This sheet will serve as the foundation of your model, making it easy to update and adjust assumptions without affecting the overall structure.
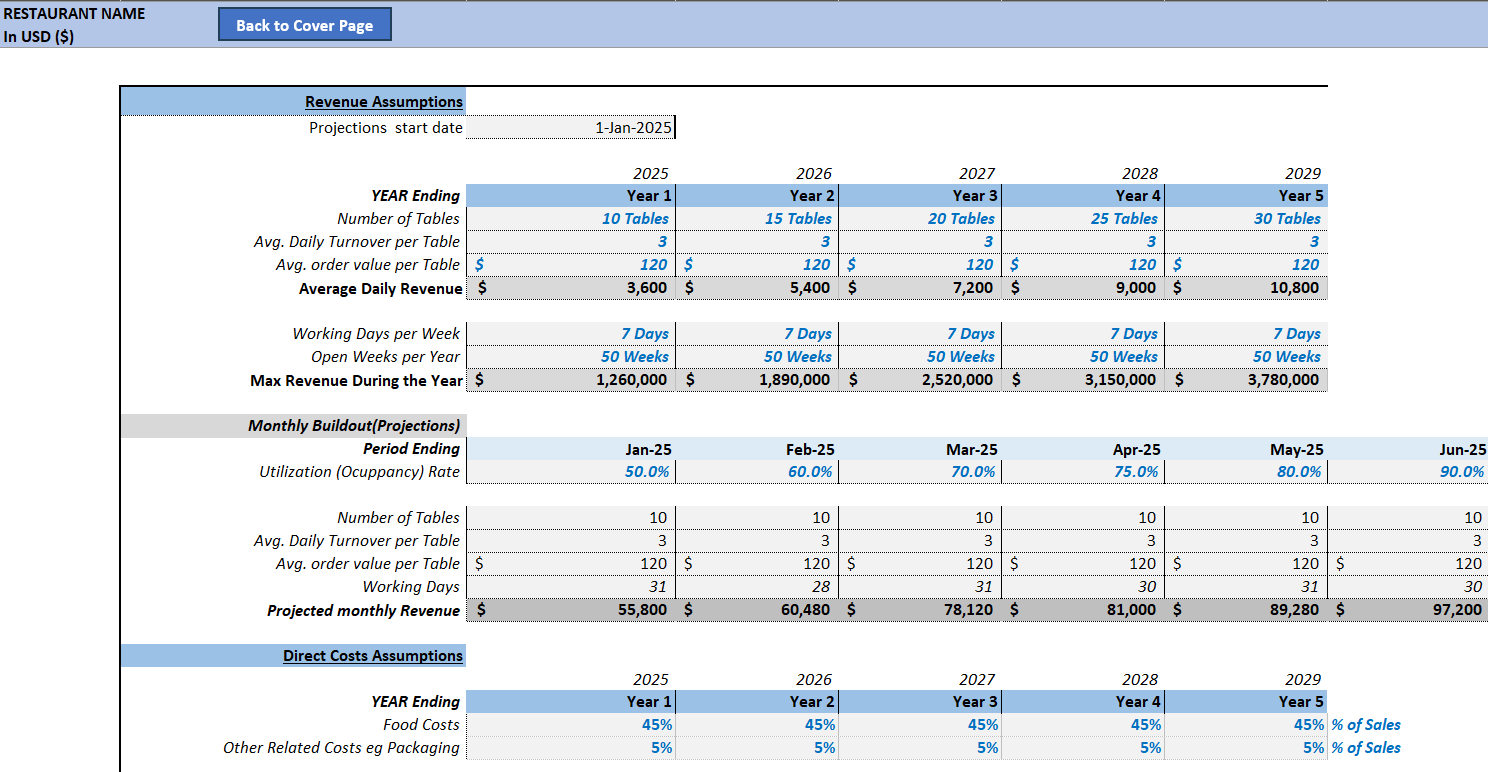
Step 4: Calculate Revenue Projections
To forecast your revenue, use two different approaches: Average Check Size and RevPASH.
- Using Average Check Size:
Monthly Revenue = Average Check Size × Sales Volume × Days Open
- Using RevPASH:
RevPASH = Total Revenue / Total Available Seat Hours
To calculate total available seat hours, consider the number of seats and the hours of operation.
Example Calculation
Assuming your restaurant is open 30 days a month with 50 seats and operates for 10 hours a day:
- Average Check Size Calculation:
Monthly Revenue = 25 × 100 × 30 = $75,000
- RevPASH Calculation:
Total Available Seat Hours = 50 seats × 10 hours × 30 days = 15,000 hours
RevPASH = 75,000 / 15,000 = $5.00
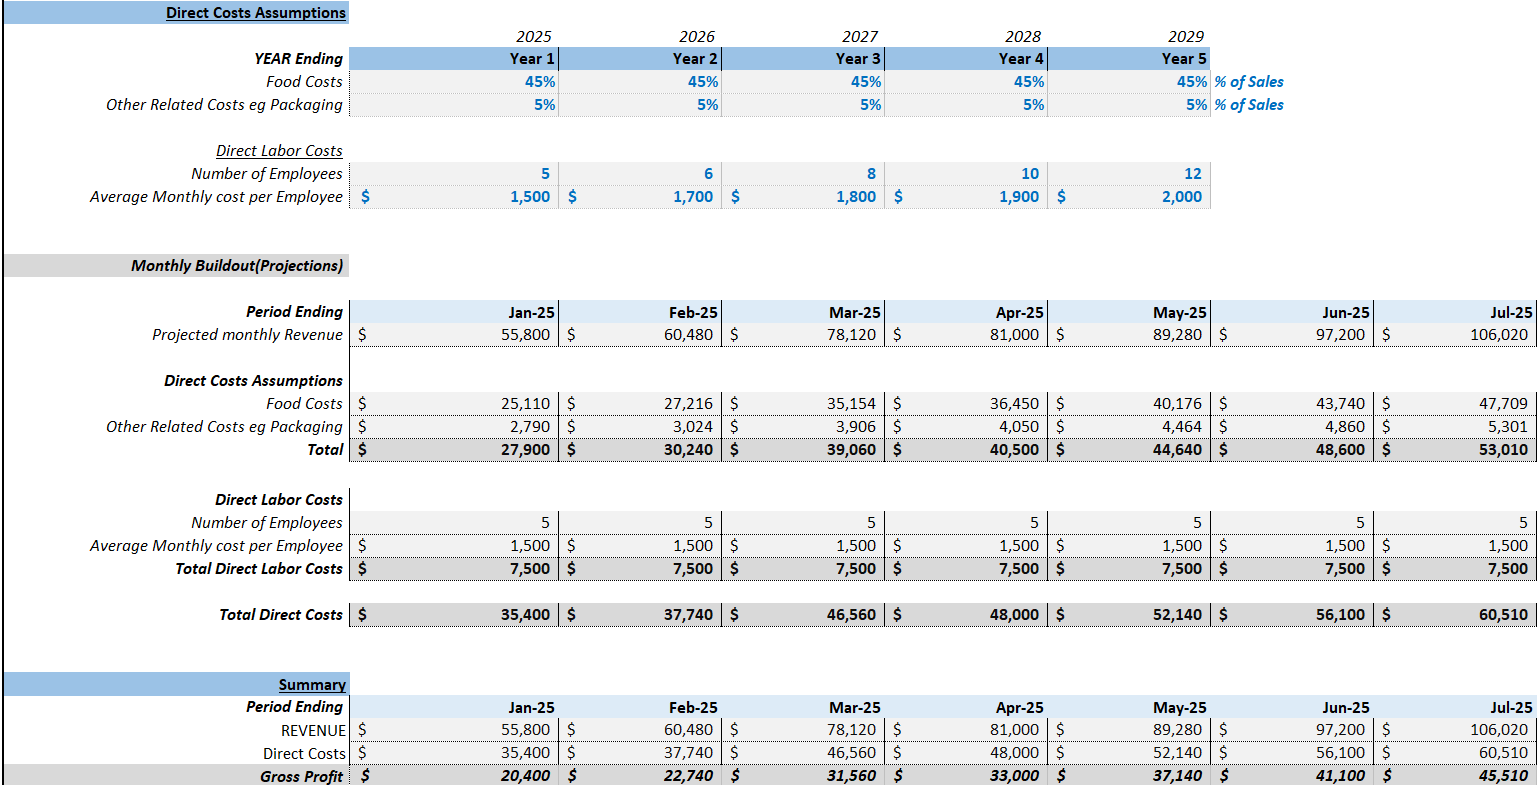
Step 5: Calculate Cost of Goods Sold (COGS)
COGS refers to the direct costs associated with producing menu items. This includes food and beverage costs, typically expressed as a percentage of sales. Use the following formula:
COGS = Revenue × COGS Percentage
Example Calculation
Assuming a COGS of 30%:
Monthly COGS = 75,000 × 0.30 = $22,500
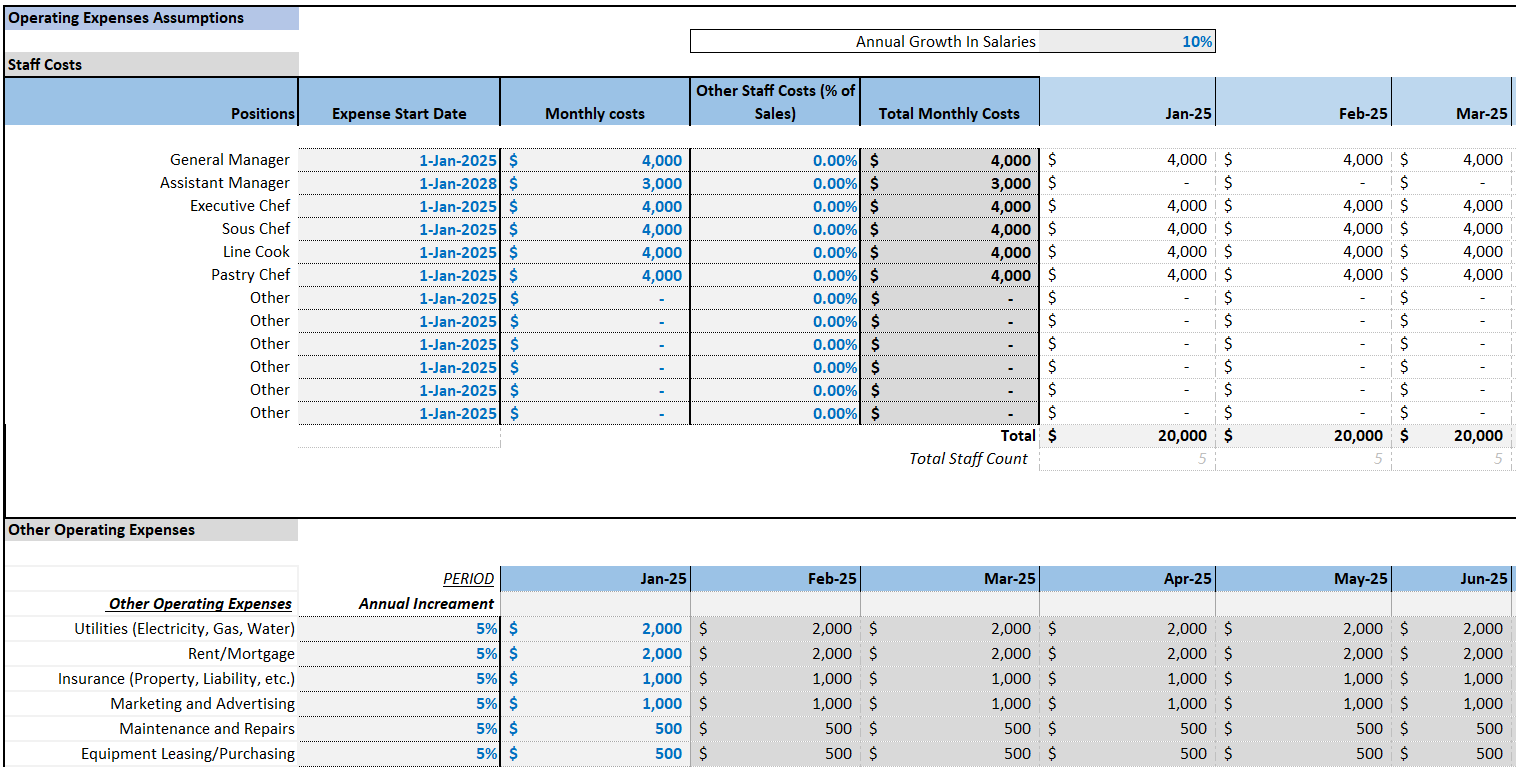
Step 6: Calculate Operating Expenses
Operating expenses encompass all indirect costs associated with running your restaurant. These may include:
- Rent: Monthly lease payments for your space.
- Utilities: Gas, electricity, and water bills.
- Salaries and Wages: Compensation for staff and management.
- Marketing and Advertising: Expenses related to promoting your restaurant.
- Other Expenses: Miscellaneous operational costs.
Sum these costs to find your total monthly operating expenses.
Example Calculation
If your monthly operating expenses total $15,000:
Total Operating Expenses = 15,000
Step 7: Calculate Table Turnover
Table turnover is a measure of how effectively your restaurant uses its seating capacity. It indicates how many times a table is occupied during a meal period.
To calculate table turnover, use the following formula:
Table Turnover = Total Customers Served / Total Number of Seats
Example Calculation
If you expect to serve 100 customers per day in a restaurant with 50 seats:
Table Turnover = 100 / 50 = 2 times
Step 8: Create a Cash Flow Statement
The cash flow statement summarizes all cash inflows and outflows over time. Organize it into sections:
- Cash Inflows: Include total revenue from food and beverage sales.
- Cash Outflows: Include COGS and operating expenses.
Example Cash Flow Summary
| Month | Cash Inflows | Cash Outflows | Net Cash Flow |
|---|---|---|---|
| 1 | $75,000 | $22,500 (COGS) + $15,000 (OpEx) = $37,500 | $37,500 |
| 2 | $75,000 | $37,500 | $37,500 |
| 3 | $75,000 | $37,500 | $37,500 |
Step 9: Calculate Capital Expenditures (CapEx)
CapEx refers to the initial and ongoing investments necessary for running your restaurant. This could include kitchen equipment, renovations, furniture, and fixtures.
Outline these expenses in your model, differentiating between initial and ongoing costs.
Example CapEx Schedule
| Year | Amount | Purpose |
|---|---|---|
| 0 | $200,000 | Initial Setup (kitchen, furniture) |
| 1 | $20,000 | Equipment Replacement |
| 2 | $10,000 | Renovations |
Step 10: Calculate Overhead Rate
The overhead rate is a measure of the indirect costs incurred in running your restaurant. It’s calculated as follows:
Overhead Rate = Total Operating Expenses / COGS
Example Calculation
Using previous data:
Overhead Rate = 15,000 / 22,500 ≈0.67 or 67%
This indicates that for every dollar spent on COGS, there is an additional $0.67 in overhead costs.
Step 11: Calculate Key Performance Indicators (KPIs)
To evaluate your restaurant’s performance, calculate essential KPIs such as:
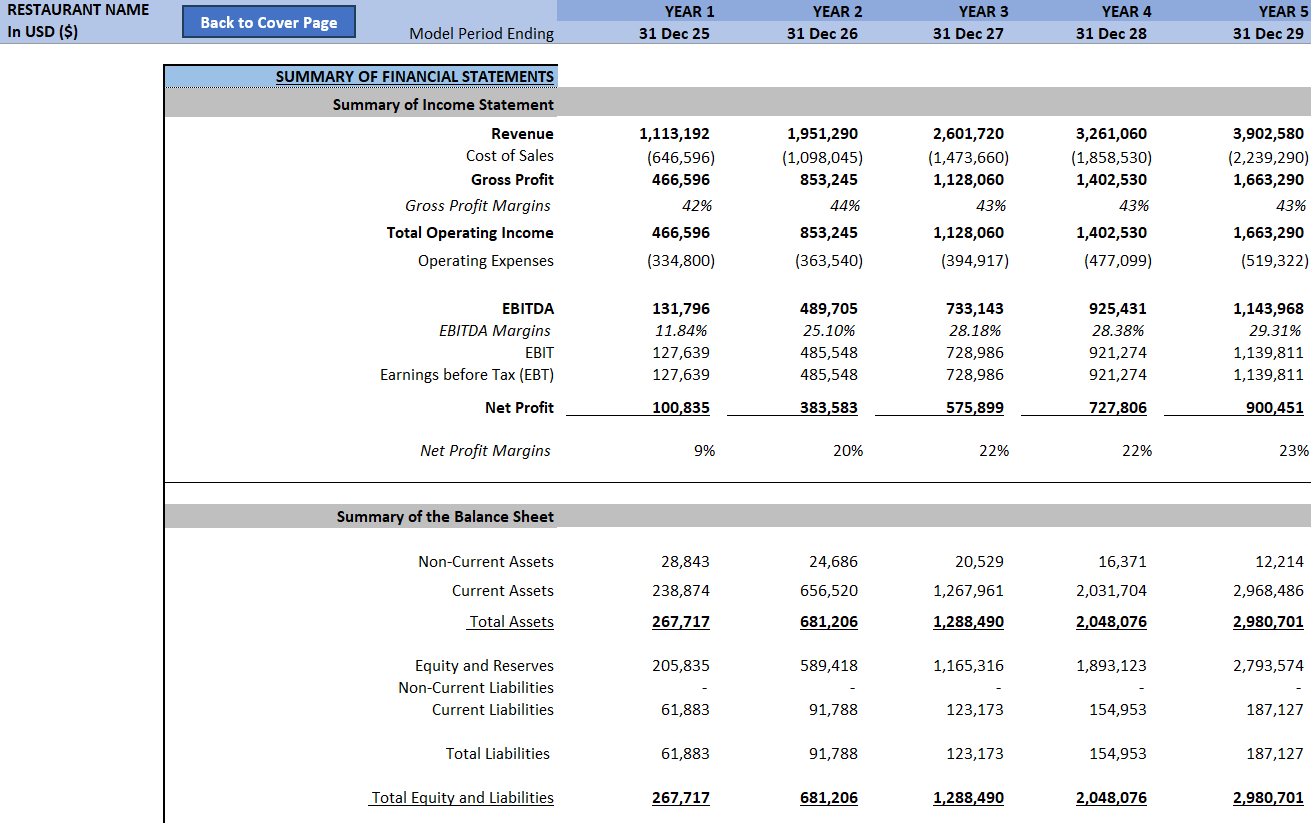
- Gross Profit:
Gross Profit = Revenue − COGS
- Gross Profit Margin:
Gross Profit Margin = Gross Profit / Revenue × 100
- Net Profit:
Net Profit = Revenue − Total Costs
Step 12: Perform Sensitivity Analysis
Conducting sensitivity analysis is essential for understanding how changes in key assumptions impact financial outcomes. Focus on crucial variables like average check size, sales volume, and costs. For instance, evaluate how a 10% increase or decrease in average check size affects net profit and cash flow.
Step 13: Review and Refine Your Model
Once your initial model is complete, review it for accuracy and logical flow. Ensure that all calculations are correct and that inputs are clearly defined. It’s also beneficial to seek feedback from industry peers or financial advisors to identify areas for improvement.
Step 14: Use the Model for Decision-Making
Now that you have a comprehensive financial model, leverage it for decision-making. Whether you are considering a new menu item, adjusting pricing strategies, or planning for expansion, your model can provide valuable insights.
Example Scenarios for Decision-Making
- New Menu Item: Estimate the impact of introducing a new dish on overall sales and profitability.
- Adjusting Prices: Analyze how a price increase might affect customer volume and overall revenue.
- Expansion Plans: Evaluate the financial implications of opening a new location or expanding existing space.
Final Thoughts!
How to build a restaurant financial model? Start by defining assumptions, structuring your model, calculating revenues and expenses, and analyzing key performance metrics. As you gain experience, you can incorporate advanced techniques and regularly update your model with actual performance data for greater accuracy.
This are also excellent articles you may like to have a look at for what metrics are important for a Restaurant business: 21 Restaurant Metrics and How to Calculate Them , Top 7 Benchmark KPIs Every Restaurant Owner Should Measure , Mastering Restaurant Metrics: Your Comprehensive Guide to Business Success and 10 Restaurant Metrics to Monitor for Financial Success
FAQs
Which is the last step in building a financial model?
The last step in building a financial model is to review and validate the model. This involves checking for errors, ensuring that formulas work correctly, confirming that the assumptions align with historical data, and verifying that outputs are logical and accurate. It may also include stress-testing the model by altering key assumptions to see how changes impact results.
How are financial models prepared?
Financial models are prepared through a structured process:
- Gather Data: Collect relevant historical financial data and market research.
- Outline Assumptions: Define key assumptions such as growth rates, cost structures, and financing terms.
- Build the Model: Use spreadsheet software (often Excel) to create the model, organizing it into sections like income, expenses, and cash flows.
- Input Formulas: Incorporate formulas to calculate revenues, costs, and key financial metrics automatically.
- Test Scenarios: Create different scenarios to analyze the model’s performance under various conditions.
How do you do a financial analysis for a restaurant?
To conduct a financial analysis for a restaurant:
- Evaluate Revenue Streams: Analyze sales data, including dining in, takeout, and catering.
- Calculate Costs: Break down expenses into categories such as food costs, labor costs, overhead (rent, utilities), and marketing.
- Assess Profit Margins: Determine gross profit margin (sales minus cost of goods sold) and net profit margin (net income divided by total revenue).
- Perform Cash Flow Analysis: Track cash inflows and outflows to ensure the restaurant maintains sufficient liquidity for operations and growth.
- Benchmark Performance: Compare key metrics against industry standards to identify areas for improvement.