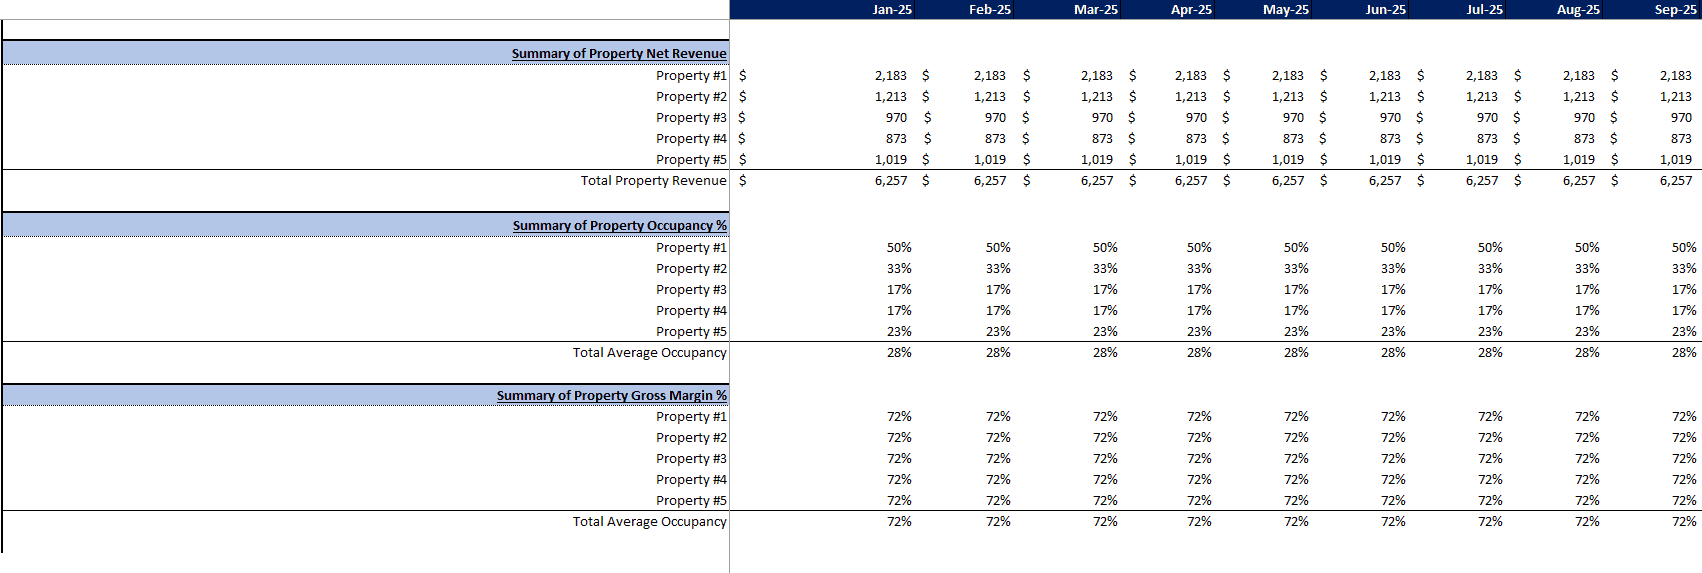
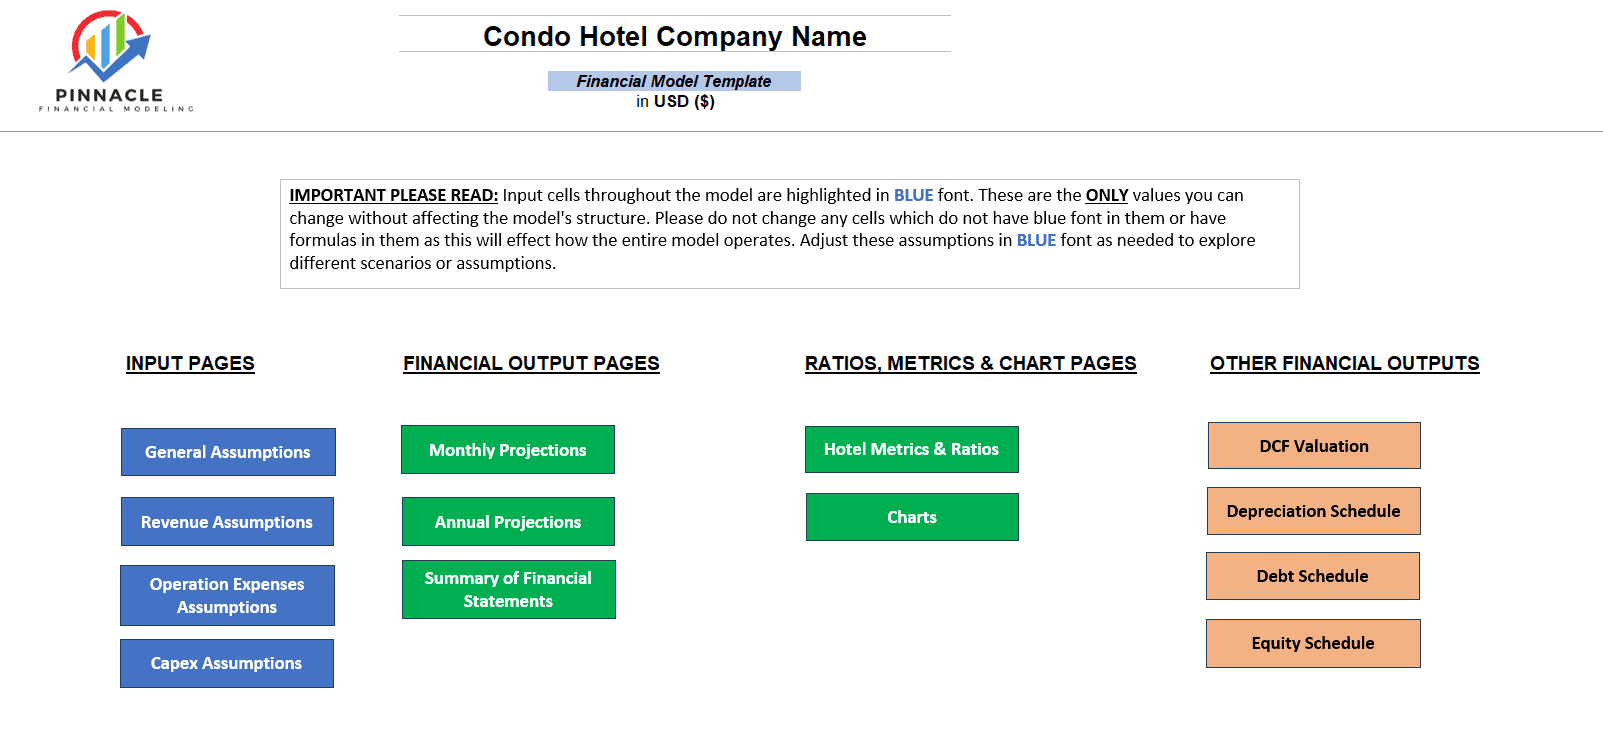
This model includes all the key variables you would need to consider with specific Rental Property metrics you can track (Net Property Revenue (post Rental Property service fees), Occupancy Rate Per Property, # Of Nightly Bookings Made). Users will easily be able to navigate the model with all input fields highlighted in Blue font.
These models are designed to be the perfect financial tool for business owners to use to make decisions for their property or multiple properties and also to provide to a snapshot of how the business is currently performing and what the forecasts look like. We have included inputs for 5 properties, with the user easily being able to add or delete properties according to their needs.
Revenue & Direct Costs Assumptions
Starts with basic model questions on the Start date of the model, Number of Nights Available for Rent Per month, corporate tax rate, and Rental Property Service Fee %.
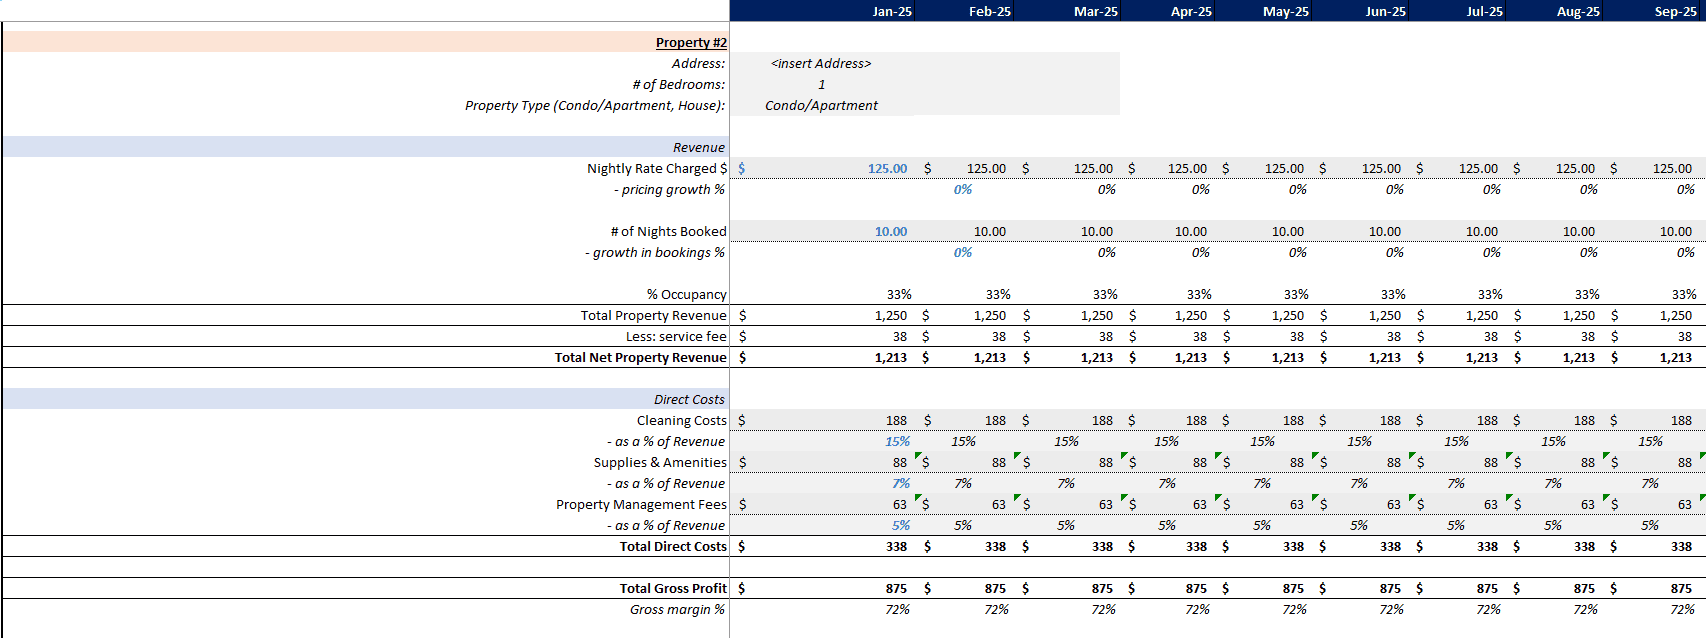
Revenue assumptions are the anticipated factors that drive a company’s income generation over a specific period. These assumptions form the basis for financial projections and are crucial for planning and decision-making. In our model, we have included detailed inputs for 5 Rental Property properties, with each Property’s inputs on the Nightly Rate Charged $, # of Nights Booked in a month, Occupancy $, and Rental Property Service Fee.
Direct Costs assumptions are the costs directly attributable to a company’s Revenue, and we have included inputs on the likely Rental Property direct costs of Cleaning Costs as a % of Revenue, Supplies & Amenities Costs as a % of Revenue, and Property Management Fees as a % of Revenue.
Operating Expenses Assumptions
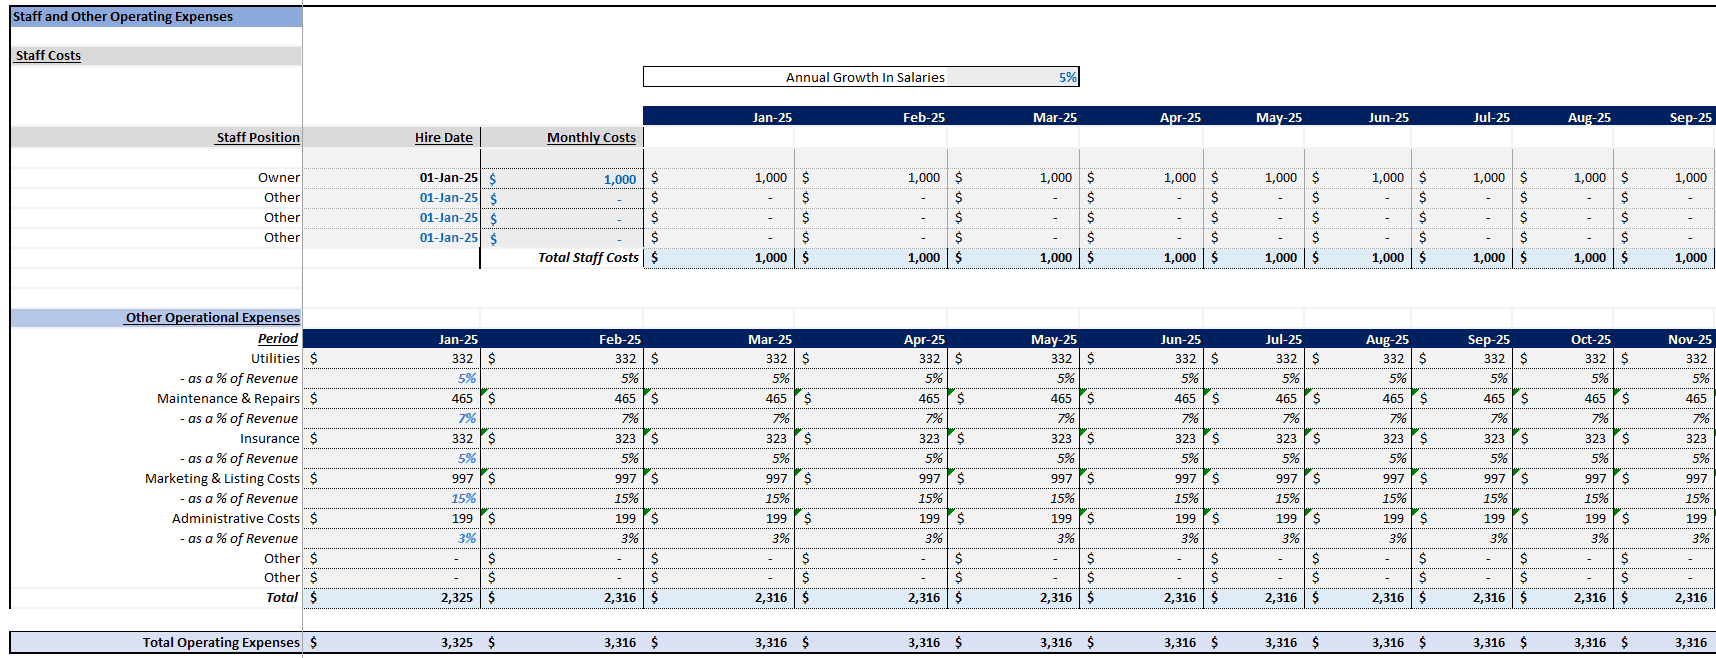
Operating expense assumptions are typically based on historical data, industry benchmarks, market trends, and management’s judgment. They are crucial for estimating the business’s total cost and determining profitability. Like revenue assumptions, it’s essential to regularly review and adjust operating expense assumptions to reflect changes in the business environment and ensure the accuracy of financial forecasts. Our model includes detailed inputs on Staff Costs (Owner, Other) and typical Rental Property related Operational Expenditure items, including Utilities, Maintenance & Repairs, Insurance, Marketing & Listing Costs, and Administrative Costs. However, you can add any other expenses relevant to your business to this sheet.
Capex Assumptions
Capital expenditure (Capex) assumptions refer to the anticipated investments a company plans to make in long-term assets, such as property, equipment, and technology, over a specific period. These assumptions are crucial for financial planning, budgeting, and forecasting, impacting the company’s cash flow, profitability, and growth prospects. We have included a Detailed list of likely Initial Costs by a user, including Property Acquisition Costs Per Property, Furniture & Equipment Costs, Legal and Compliance Costs, and other capex-related costs, as well as a corresponding Fixed Asset Register. We have also assumed capital structure (i.e., whether property purchases were funded entirely through equity or debt).
Monthly Projections (10-year period)
We have broken down projections month-by-month when projecting income statements, balance sheets, and cash flow statements. The monthly forecast is provided over a 10-year time frame. This is particularly useful for businesses looking at month-on-month trends and insights in the business, which leads to better decision-making and budgeting should there be a need to either raise more capital, pursue growth opportunities from excess capital or pay down interest-bearing debt. Monthly projections also help a business ascertain seasonal performance when looking at growth projections on a month-over-previous-years-month basis.
Annual Projections (10-year period)
The model has Annualized Financial Projections of Income statement, Balance Sheet, and Cash Flow Statement over 10-years. Annual projections provide an excellent overview of expected revenues, expenses, profits, cash flow, and other key financial metrics for the upcoming year. Yearly predictions are essential for strategic planning, budgeting, fundraising, and performance evaluation at any stage of the business cycle.
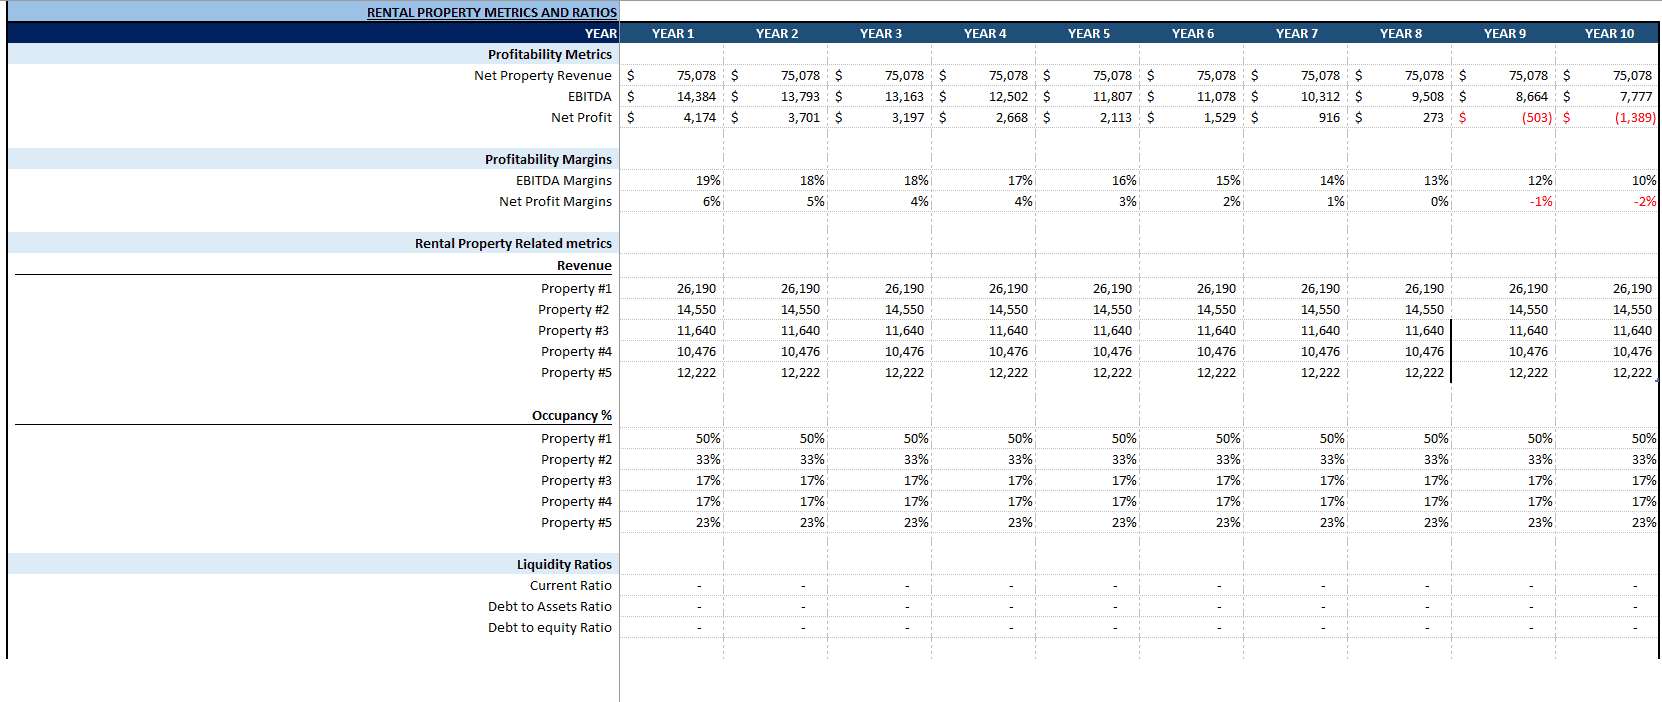
Rental Property Metrics & Ratios
Rental Property-specific metrics (Net Property Revenue (post Rental Property service fees), Occupancy Rate Per Property, # Of Nightly Bookings Made), Profitability Ratios, Liquidity Ratios, and Asset Turnover Ratios were provided.
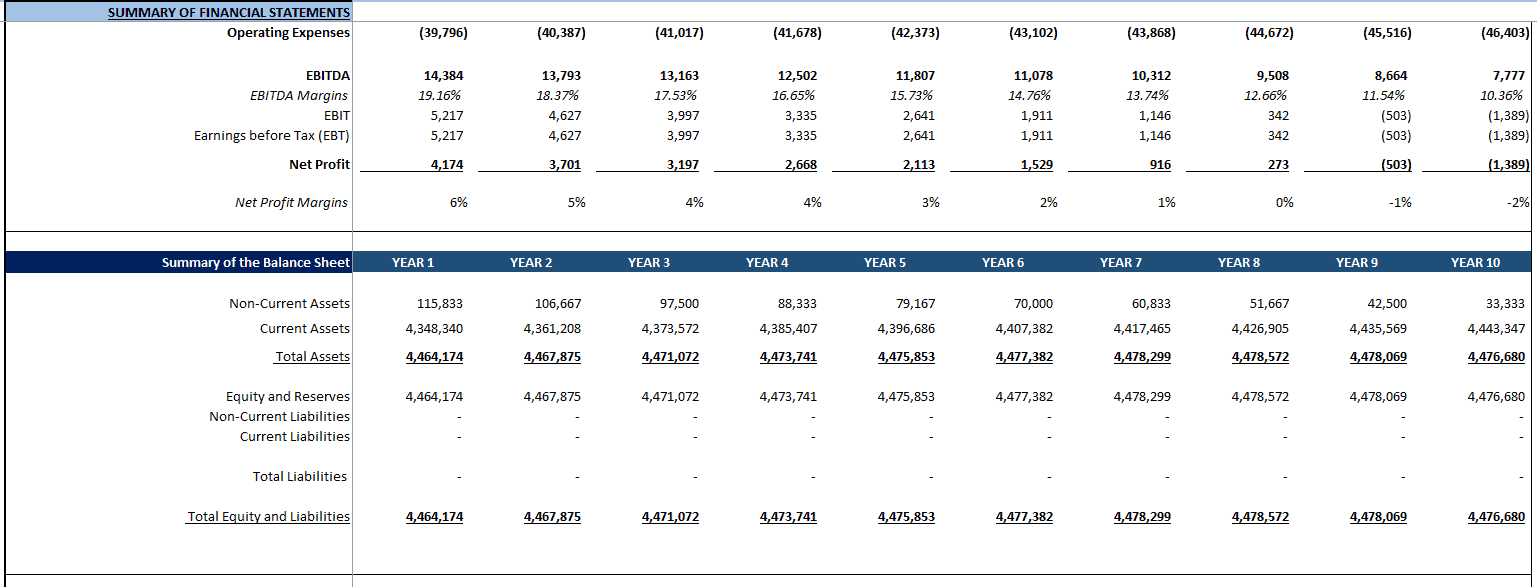
Summary of Financial Statements (10-year period)
Summarized Financial Statements over a 10-year time frame help for better snapshots of financial performance. Income Statement, Balance Sheet, and Cash Flow Statement are all provided.
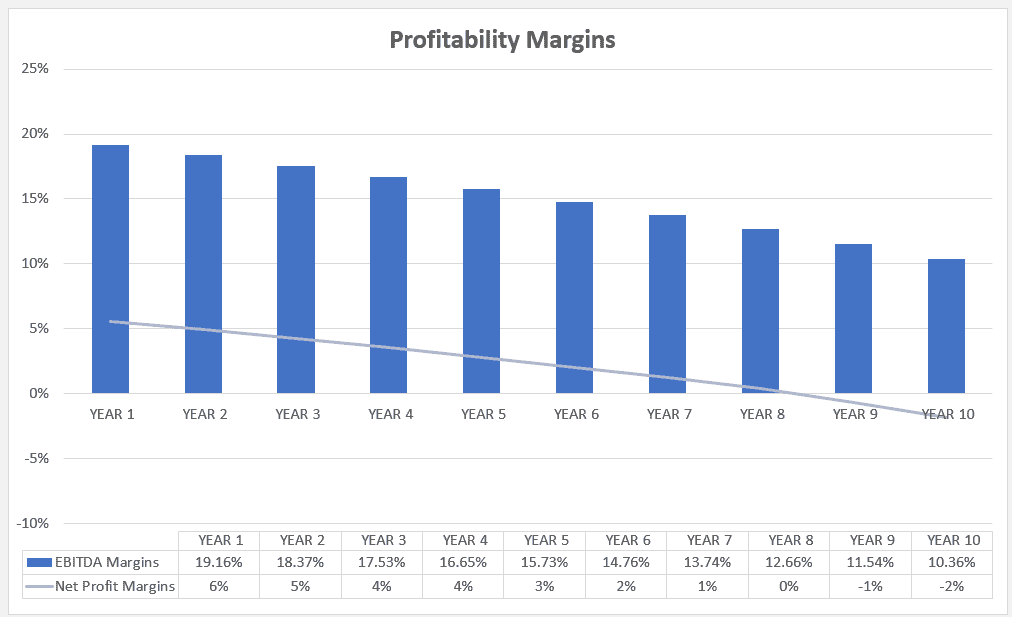
Charts
Charts available, including Profitability Analysis and Use of Funds Chart.
Depreciation Schedule
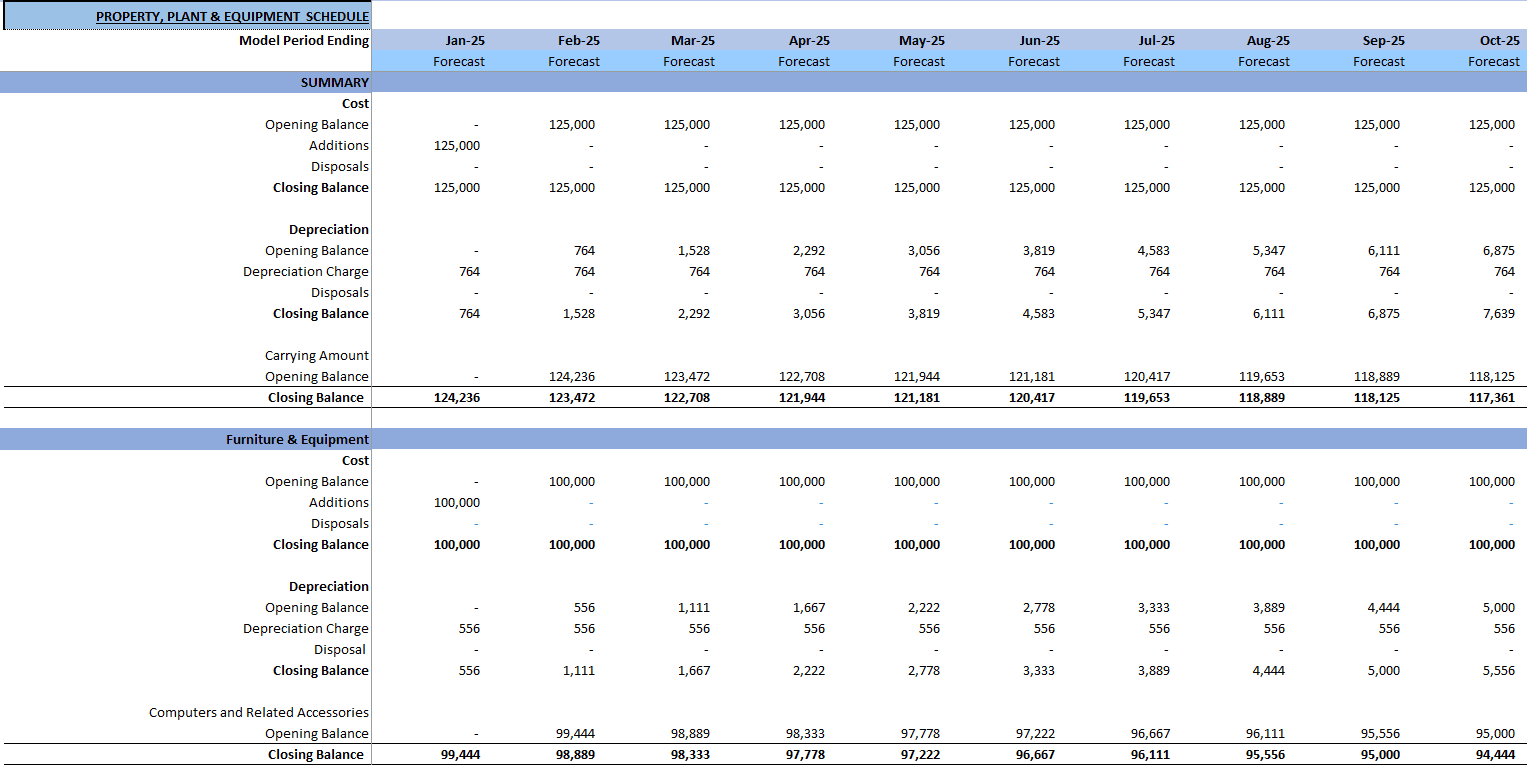
The detailed depreciation schedule shows additions/disposals to the business’ fixed asset register. Sections included Furniture & Equipment, Technology & Smart Home Devices, and Others.
Debt Schedule
Debt schedule provided with interest rate assumptions and payback period assumptions included.
Equity Schedule
Equity schedule provided with assumptions on all investments into the business by investors or owners.










Stefan M –
Perfect financial tool to see how all your properties are perfroming
Raj –
Perfect! Highly recommend!