
For many Amazon FBA sellers, the first instinct is to chase top-selling SKUs. High sales rank, booming revenue, and bestseller badges are exciting. But if you’re only looking at revenue, you might be misreading the true financial health of your business.
Sales numbers don’t always tell the full story. Behind each best-seller is a complex mix of costs, fees, marketing spend, inventory decisions, and operational challenges. Understanding the real profit of your best-selling SKUs is essential if you want to scale sustainably, invest in growth, and avoid cash flow traps.
This article explores how to evaluate the real profitability of your top SKUs, key metrics to track, and practical strategies to turn strong sales into strong bottom-line performance.
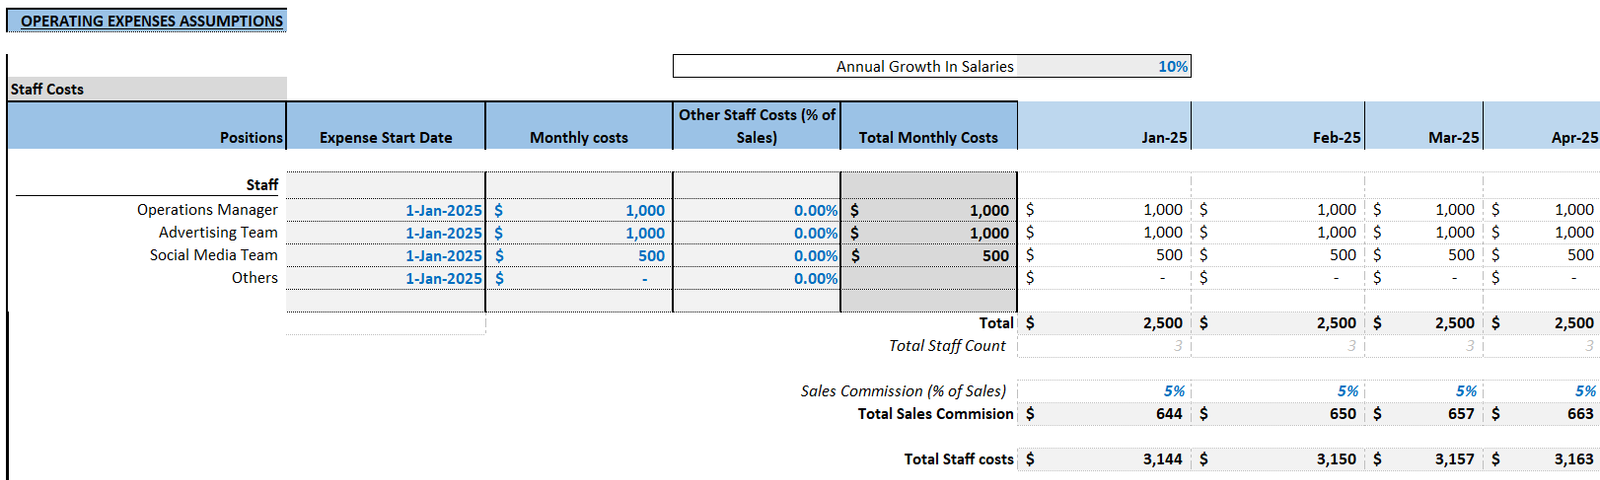
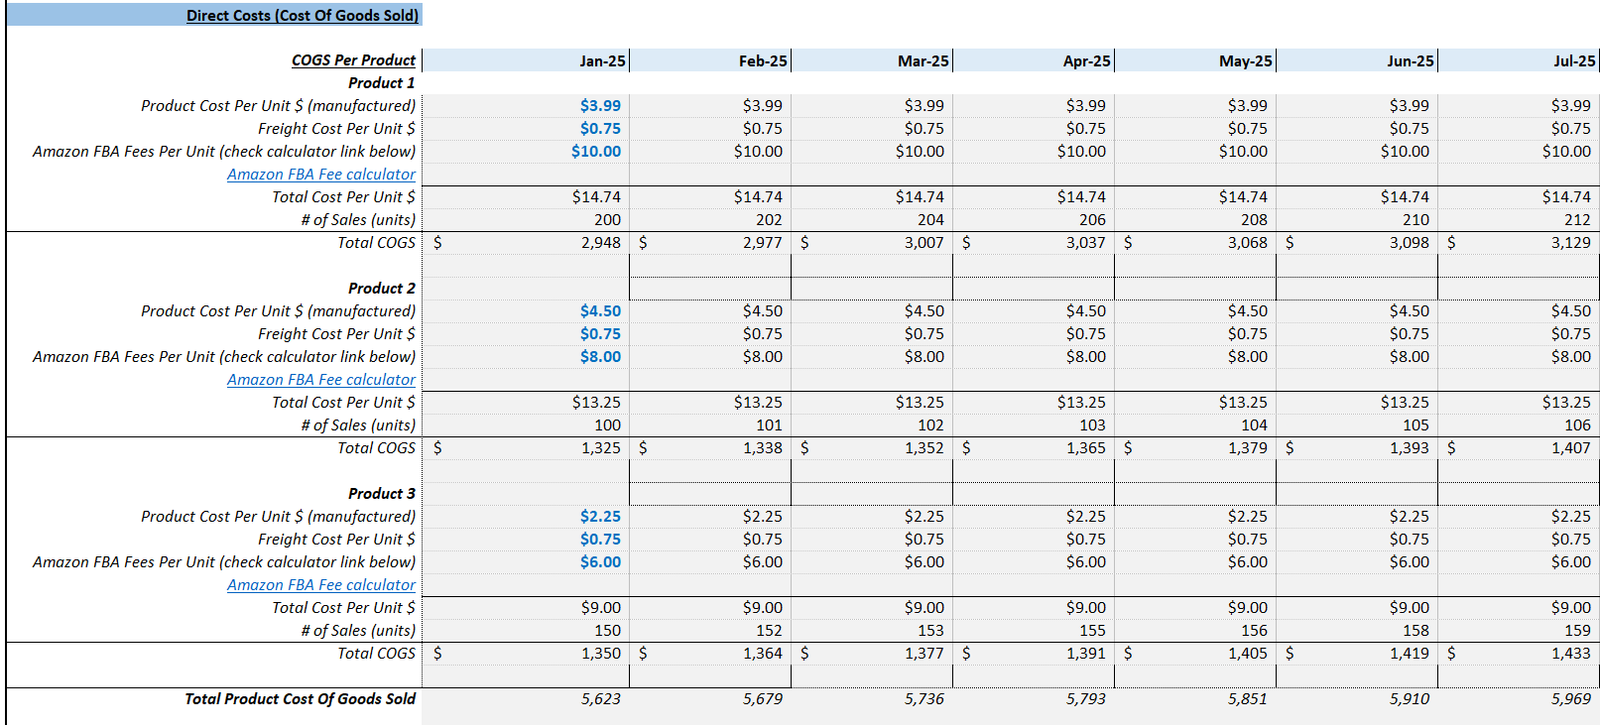
We have also built an Amazon FBA Financial Model template for those looking for a ready-to-go financial model for their business. Just input your businesses assumptions including product details (price, costs etc), and our model will do the rest. Our complete three-way financial model includes an Income Statement, Balance Sheet, and Cash Flow Statement, along with an Inventory Statement to effectively track all your inventory movements too.

Why Revenue Doesn’t Equal Profit
It’s easy to fall into the trap of thinking that your top-selling SKUs are automatically your most profitable. But there are several reasons why high revenue doesn’t always translate into high profit:
- Amazon Fees Are Complex
- FBA fulfillment fees, referral fees, storage fees, and long-term storage fees can eat into margins. Here’s how to avoid Amazon’s profitability flags.
- Advertising Costs Can Outweigh Gains
- Many sellers rely heavily on Amazon PPC to drive sales.
- Inventory and Holding Costs
- Overstocking to meet demand can lead to long-term storage fees and increased working capital requirements.
- Cost of Goods Sold (COGS) Differences
- Some high-selling SKUs have higher production, packaging, or shipping costs.
- Returns and Refunds
- Frequent returns reduce net profit, even for top sellers.

Step 1: Break Down Your SKU-Level Costs
To understand real profit, start with a detailed SKU-level cost analysis. Key elements include:
1. Cost of Goods Sold (COGS)
- Product cost, shipping, customs, and packaging
- Include any production inefficiencies or minimum order penalties
2. Fulfillment by Amazon (FBA) Fees
- Standard FBA fulfillment fees (picking, packing, and shipping)
- Monthly and long-term storage fees
3. Amazon Referral Fees
- Typically a percentage of the selling price
4. Advertising Costs
- Amazon PPC campaigns
- External advertising that drives sales
5. Returns and Refund Adjustments
- Refunds reduce revenue
Once all these are considered, you can calculate net profit per unit, which is far more revealing than gross revenue.
Step 2: Calculate Your True Contribution Margin
Your contribution margin tells you how much each SKU contributes to covering overhead and generating profit.
Contribution Margin = Net Revenue per Unit – Variable Costs per Unit
Variable costs include:
- COGS
- FBA fulfillment fees
Why Contribution Margin Matters
- Identifies which SKUs generate real profit after direct costs
- Helps you prioritize high-margin SKUs for growth
Step 3: Evaluate Profitability Across Different Channels
Many Amazon FBA sellers assume all revenue comes from Amazon, but top SKUs may also sell via Shopify or other direct-to-consumer stores. Check Amazon SKU Economics Made Easy for more insights.
Action Step
- Track SKU-level profit per channel
Step 4: Factor in Inventory Turnover
High sales velocity is attractive—but fast-moving SKUs are not always the most profitable if carrying costs or stockouts are ignored.
Why Inventory Management Matters
A SKU that sells 500 units per month but requires a huge upfront order may generate less net profit than a slower-moving SKU with higher margin per unit.
Step 5: Adjust for Seasonality and Price Fluctuations
Some SKUs sell well only during seasonal spikes. High sales volume during these times may mask low margins during off-seasons.
Step 6: Identify Hidden Margin Killers
Even best-selling SKUs can hide profit leaks: expensive packaging, bundled offers, high return rates, and storage fees for oversized items.
Action Step
- Calculate a “profit per SKU after all adjustments” metric
Step 7: Leverage Profitability Data for Strategic Decisions
Once you understand SKU-level profitability, you can make smarter decisions:
1. Focus on High-Profit SKUs
- Allocate marketing budget to high-margin products
2. Reassess Low-Margin Best Sellers
- Evaluate if they are worth the effort
3. Optimize Pricing Strategies
- Use data to determine price points that maximize net profit
4. Improve Inventory Planning
- Avoid overstocking low-margin SKUs
Step 8: Incorporate Real Profit into Business Metrics
Most FBA sellers track gross sales, but top performers go further, tracking metrics like net profit per SKU. Read about FBA seller strategies for insight.
Step 9: Build a Profit-Focused Culture in Your FBA Business
Understanding real profit requires more than spreadsheets—it requires a mindset shift. See how leading Amazon sellers use growth capital for competitive advantage.
Step 10: Continuous Improvement and Data-Driven Decisions
To maintain real profitability, review SKU-level profitability at least quarterly. Explore strategies for Amazon FBA sellers to scale effectively.
FAQs
What is the difference between gross revenue and net profit?
Gross revenue is total sales income without deductions, while net profit accounts for all expenses, fees, and costs.
How can I calculate my contribution margin?
Contribution margin is calculated by subtracting variable costs from net revenue per unit.
How often should I review SKU-level profitability?
It’s recommended to review SKU-level profitability at least once a quarter to keep up with market changes.