


$79.99
This NVIDIA Financial Model Template in Excel has been built for use by anyone looking to analyze NVIDIA and input custom assumptions (such as revenue growth rates by key divisions (Data Center Compute, Data Center Networking, Gaming, Professional Visualization, Automotive, OEM & Other), Operational costs (Cost of Revenue (ie. COGS), R&D, SG&A), capital expenditure, depreciation and amortization, balance sheet assumptions, cash flow assumptions and other assumptions) over a 5 year forecast period to determine an estimated valuation for the company using a DCF approach. Users will easily be able to navigate the model with all input fields highlighted in Blue font and yellow highlights. These models are designed to be the perfect financial tool for investors, students or anyone looking to understand how NVIDIA operates, and how future projections and cash flows could affect the valuation of the business. All historical “actuals” have been input from NVIDIA’s financial statements publicly released, and all forecasts currently in the model are based on assumptions we have input for educational purposes only and do not reflect the views of NVIDIA or any other party other than us.
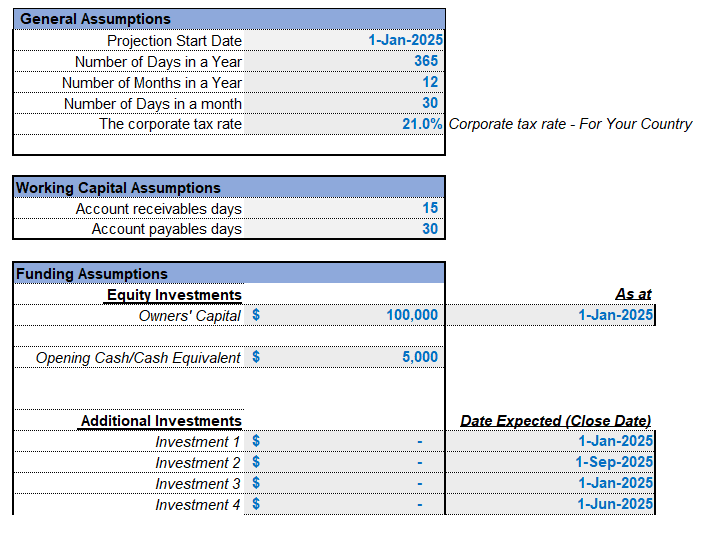
Input Assumptions
Revenue assumptions have been segregated by each division of NVIDIA. In our model we have included inputs on quarterly growth rates for each of NVIDIA’s key divisions including:
Operating Expenses Assumptions
Operating expense assumptions are typically based on historical data using a % of revenue as a forecasting method. In particular, assumptions have been created for:
Capex Assumptions and Other Expenses
Capital expenditure (Capex) assumptions refer to the anticipated investments a company plans to make in long-term assets, such as property, equipment, and technology, over a specific period. Capital expenditures are low relative to revenue because NVIDIA operates a fabless model, so capex is often just 2-3% of revenue.
One-time charges, interest, and taxes should be modeled according to disclosure and updated guidance (for example, a tax rate of 17% is expected in FY2025).
Quarterly Projections (5 year period)
We have broken down projections on a Quarter by Quarter basis when projecting Income Statement, Balance Sheet and Cash Flow Statement items for NVIDIA based on NVIDIA’s quarterly reporting cycle. This has been done for a 5 year forecast period to FY2030. Quarterly granularity enables more timely and accurate updates to revenue and expense forecasts, capturing business trends (like AI demand spikes or new product launches), short-term margin variability, and seasonality in core segments such as Data Center and Gaming. Quarterly projections also make the model compatible with NVIDIA ‘s financial reports, which are issued every three months and followed closely by analysts and investors to assess sales momentum, cost management, and forward guidance. This approach allows for scenario testing—such as modeling the impact of a major product or regulatory change—and provides more actionable insights for both short-term trading and long-term strategic analysis.
Annual Projections (5 year period)
The model has Annualized Financial Projections of Income Statement, Balance Sheet and Cash Flow Statement for NVIDIA over a 5 year time frame. Annual projections provide an excellent overview of expected revenues, expenses, profits, cash flow, and other key financial metrics for the upcoming year. We have also included 10 years worth of historical numbers from FY2015.
Outputs
The outputs section include three core financial statements: Income Statement, Balance Sheet, and Cash Flow Statement. Each serves a different purpose and provides key insights for investors and analysts. Outputs have been provided on both a quarterly and annual basis.
Valuation
The Discounted Cash Flow (DCF) valuation for NVIDIA estimates the intrinsic value of the company by projecting its future free cash flows and discounting them back to present value using a weighted average cost of capital (WACC). Whilst the free cash flow section is driven by earlier input assumptions and cannot be adjusted by the user in this section; the user can adjust the ‘Cost of Equity’ assumptions (ie. Bond rate, market risk premium, unleveraged beta, leverage ratio) as well as the ‘Cost of Debt’ assumptions (debt risk premium, tax rate) and medium/long-term growth rates. Users can also put in the current NVIDIA share price in order to see what Upside or downside as a %, the model’s valuation is relative to the current share price.
Important Disclaimer:
This financial model has been prepared solely for illustrative and educational purposes and should not be relied upon for investment, legal, accounting, or tax decisions. The projections, forecasts, and assumptions contained herein are hypothetical and do not represent the views or financial guidance of NVIDIA Corporation. This model is an independent analysis and is not affiliated with, endorsed by, or approved by NVIDIA Corporation or any of its subsidiaries. All data, including historical figures and forward-looking estimates, are based on publicly available information and should be independently verified. Actual results may differ materially from the assumptions used in this model. By using this model, you acknowledge and agree that the creator bears no responsibility for any decisions or actions taken based on its content.
No account yet?
Create an Account