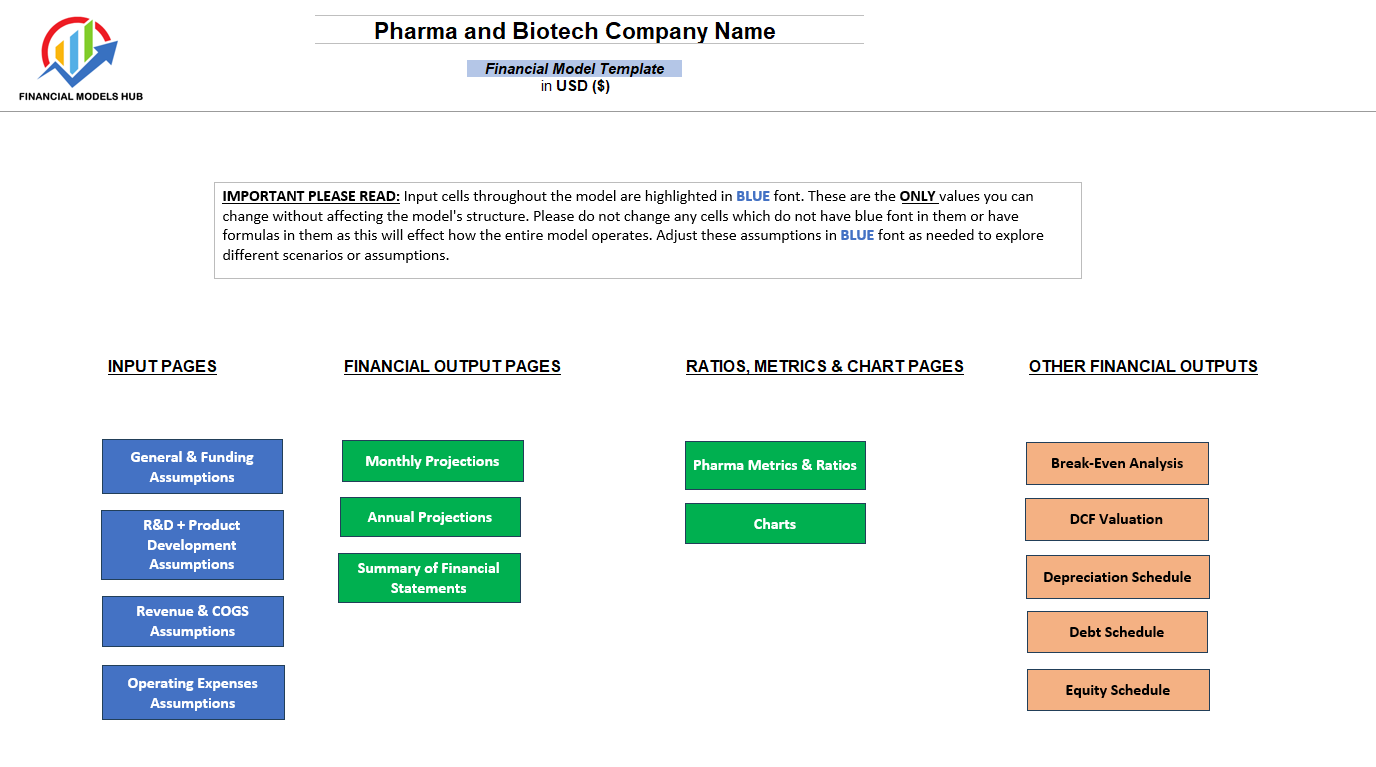
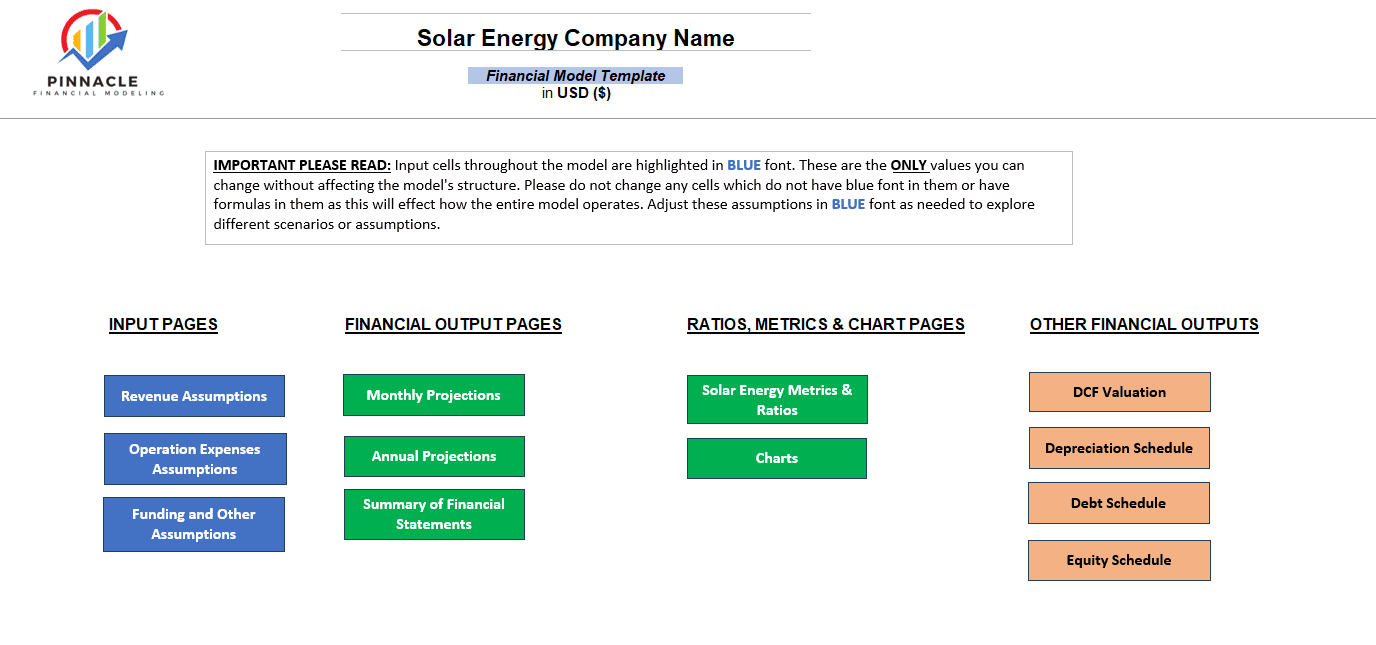
This Model has been purposefully built to suit any startup business, whether you are selling a product or a service, and can be tailored to each founder’s needs. Useful metrics, ratios, charts, and summaries are also provided throughout the model, and users will easily be able to navigate the model with all input fields highlighted in Blue font. These models are designed to be the perfect financial tool for business owners looking to make decisions for their company, forecast their company expectations, and see what their company is valued at based on future cash flow projections. This model can also be a perfect tool to give to external stakeholders or investors who want a snapshot of how a business is currently performing and what the forecasts look like.
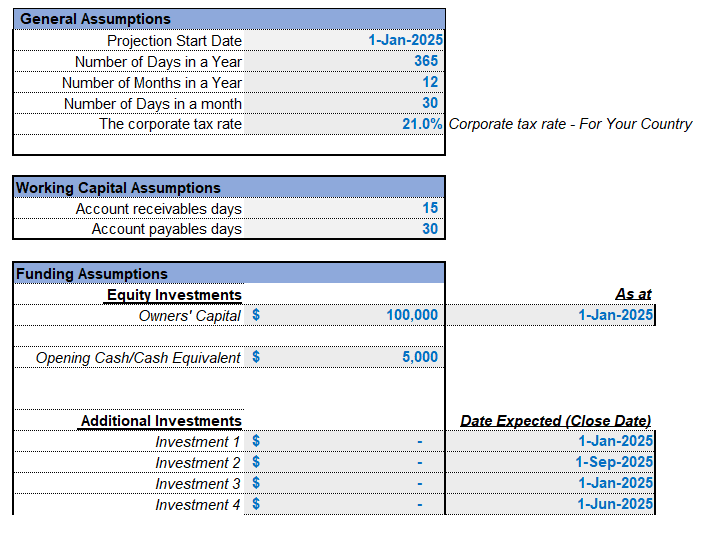
General Assumptions
Starts with basic model questions on start date of the model, tax rate assumption, working capital assumptions and funding assumptions.
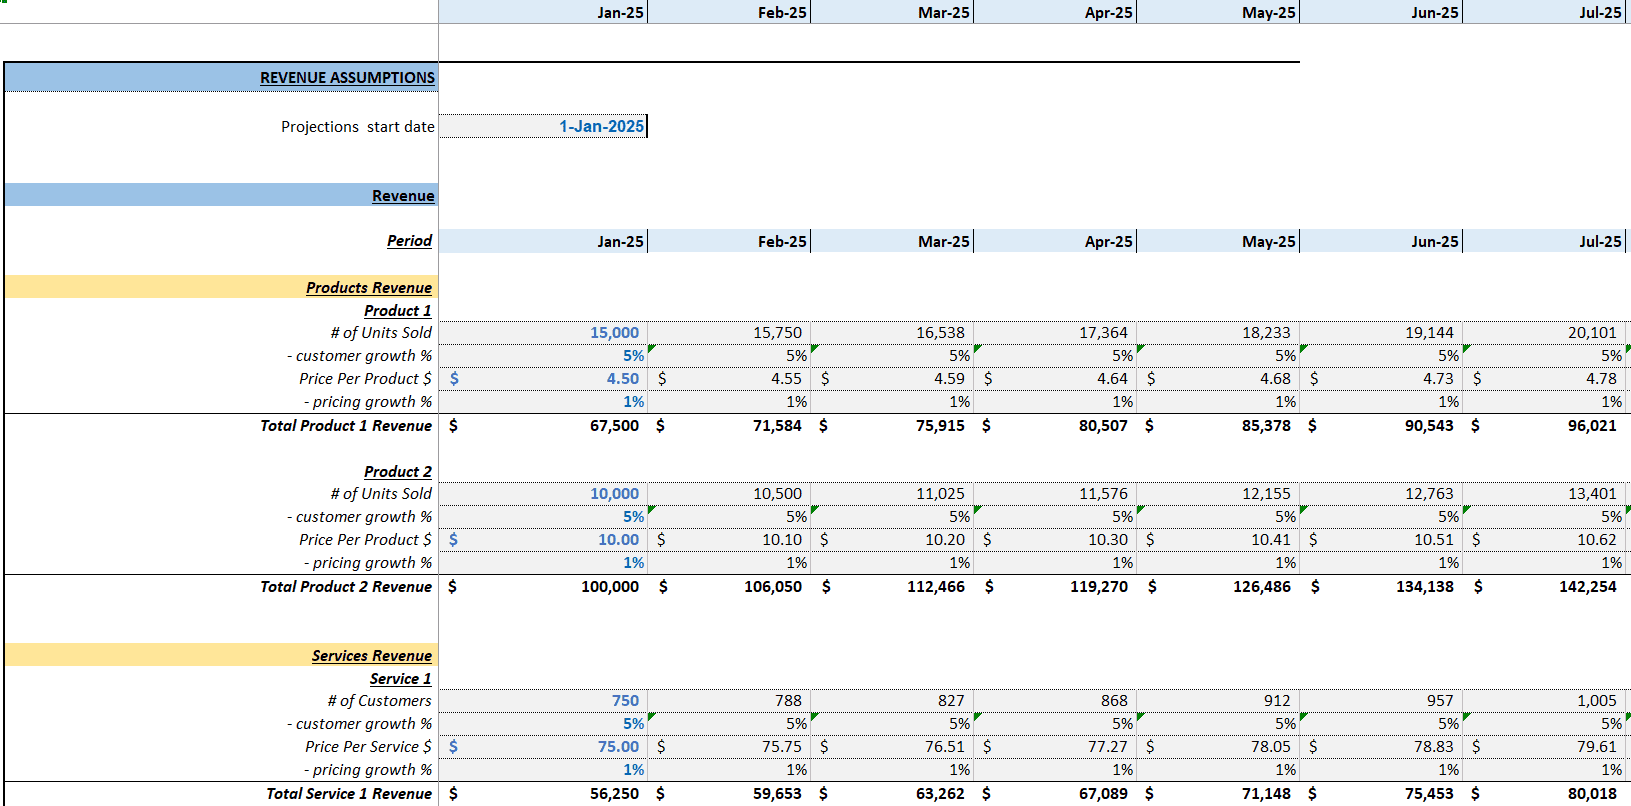
Revenue and Direct Cost Assumptions
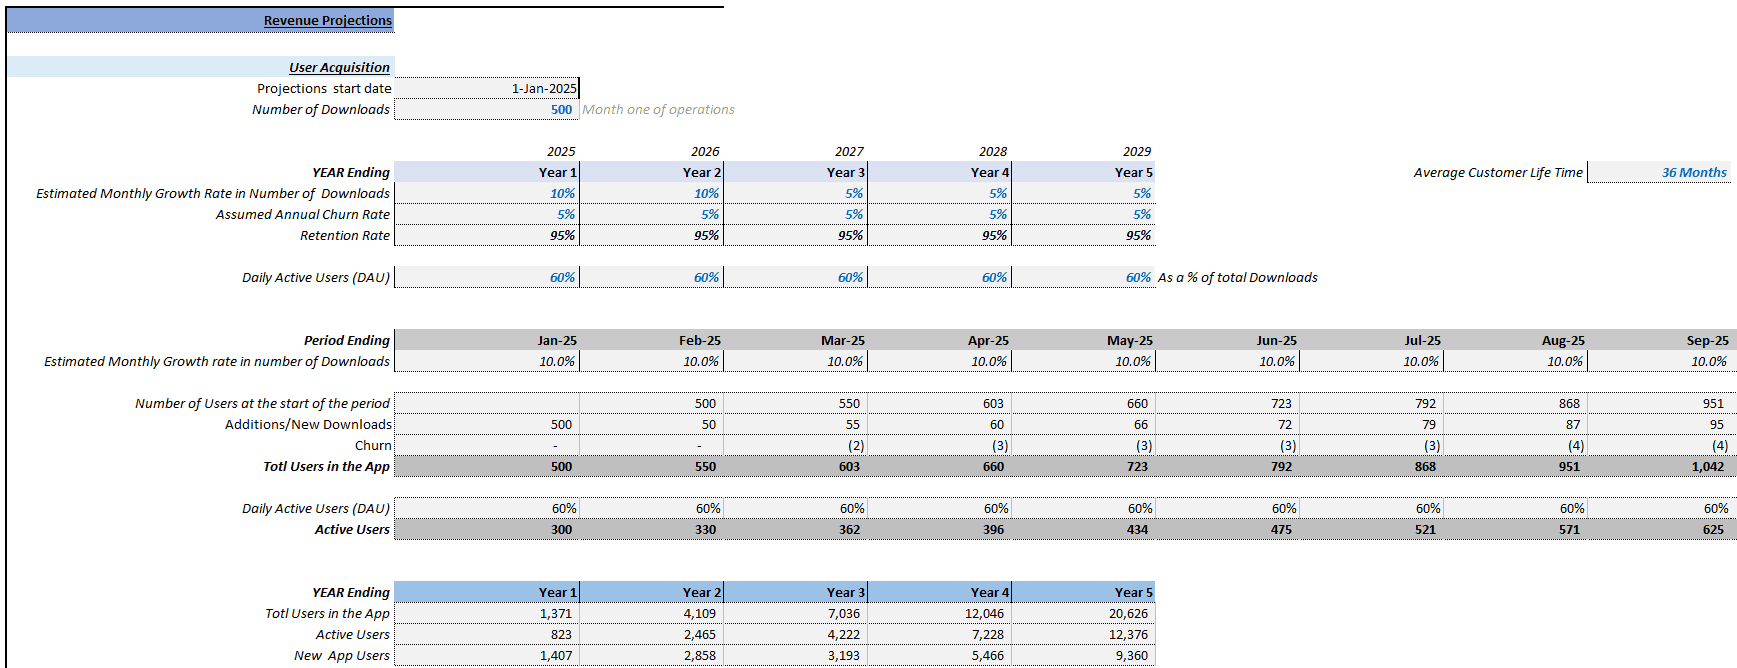
Revenue assumptions are the anticipated factors that drive a company’s income generation over a specific period. These assumptions form the basis for financial projections and are crucial for planning and decision-making. In our model, we have included detailed inputs by Revenue category. We have included input fields for 3 different types of Revenue your business may be deriving – Product, Services, or Subscription. Each has its individual input drivers on # of units sold, # of customers or # of subscribers, and also the pricing per product, service, or subscription. Simply tailor the model based on your Company is selling (i.e. if selling Products, then you can zero out the Services and Subscription fields). And similarly so if your Company is only selling Services (i.e. zero out Product and Subscription fields).
We have also included Direct Costs based on each Revenue category and the most relevant Cost fields as a % of Revenue to forecast going forward.
Operating Expenses Assumptions
Operating expense assumptions are typically based on historical data, industry benchmarks, market trends, and management’s judgment. They are crucial for estimating the business’s total cost and determining profitability. Like revenue assumptions, it’s important to regularly review and adjust operating expense assumptions to reflect changes in the business environment and ensure the accuracy of financial forecasts. In our model we have included detailed inputs on Staff costs by Category Type (Management, Development Team, Customer Service Team, Sales Team, Other Department), and Typical Operational Expenditure items (Rent, Office Supplies, Dues and Subscriptions, Airfare, Accomodation), however, you can add any other expenses you think may be relevant to your business in this sheet.
Capex Assumptions
Capital expenditure (Capex) assumptions refer to the anticipated investments a company plans to make in long-term assets, such as property, plant, equipment, and technology, over a specific period. These assumptions are crucial for financial planning, budgeting, and forecasting, as they impact the company’s cash flow, profitability, and growth prospects. We have included a Fixed asset cost assumption schedule here for the main items likely to be on a company’s capex sheet and also a Use Of Funds assumption list with a corresponding pie chart.
Monthly Projections
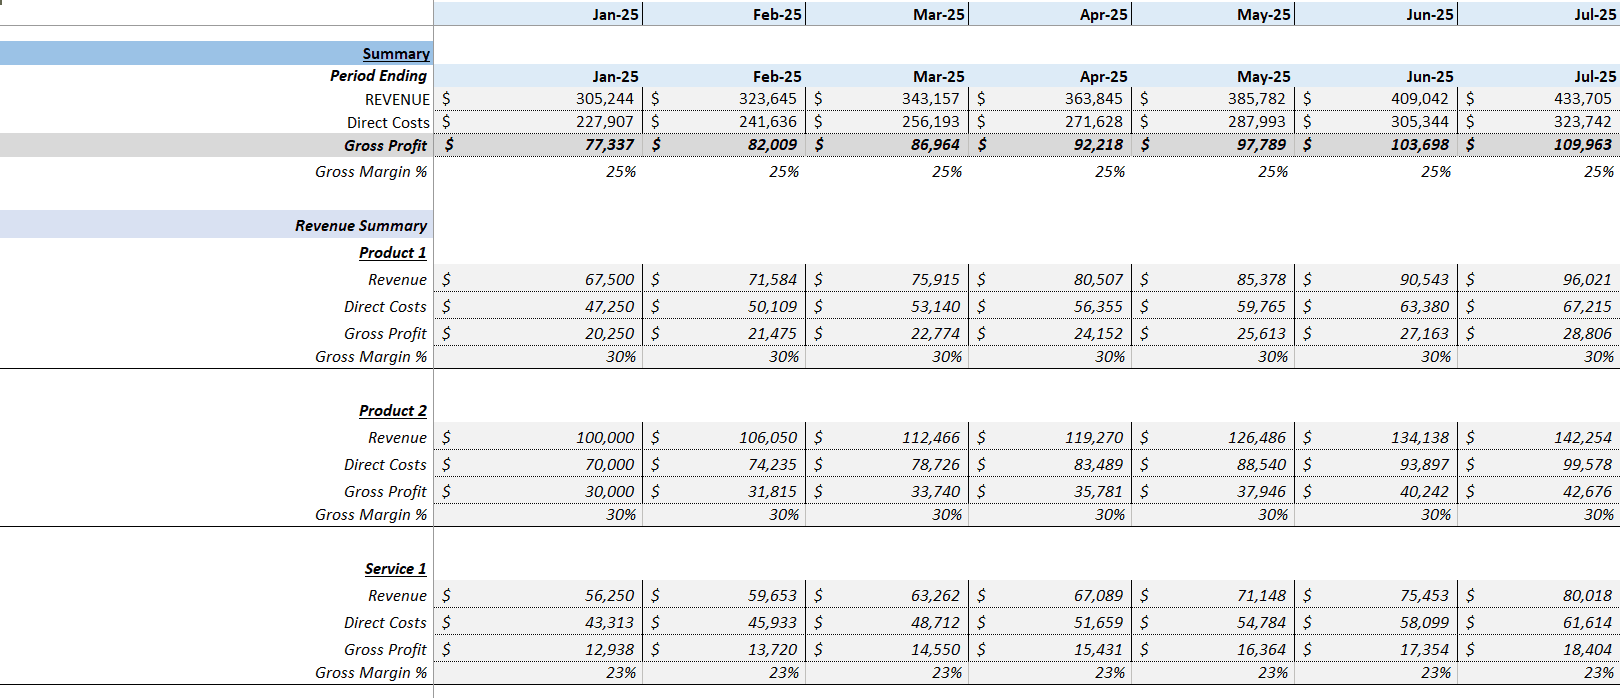
We have broken down projections on a Month by Month basis when projecting Income Statement, Balance Sheet and Cash Flow Statement items. The monthly projections are provided over a 5 year time frame. This is particularly useful for businesses looking at month-on-month trends and insights in the business, which leads to better decision making and also better budgeting should there be a need to either raise more capital, pursue growth opportunities from excess capital or pay down interest bearing debt. Monthly projections also help a business ascertain what performance may be seasonal in nature when looking at growth projections on a month-over-previous-year’s-month basis.
Annual Projections
The model has Annualized Financial Projections of Income Statement, Balance Sheet and Cash Flow Statement over a 5 year time frame. Annual projections provide an excellent overview of expected revenues, expenses, profits, cash flow, and other key financial metrics for the upcoming year. Annual projections are essential for strategic planning, budgeting, fundraising, and performance evaluation for any company at any stage of their business cycle.
Financial Metrics & Other Metrics
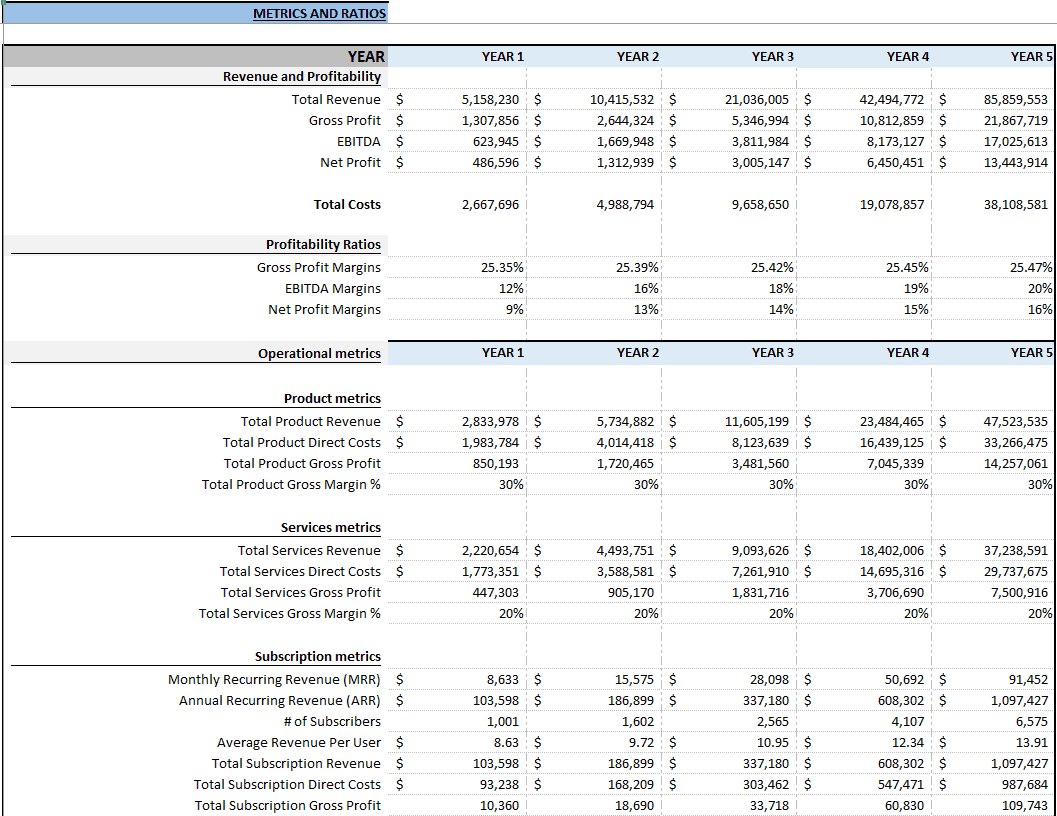
Financial metrics and Ratios have been included, highlighting Revenue and Profitability, Profitability Ratios, Operational Metrics, and Revenue By Category over a 5-year time frame.
Summary of Financial Statements
Summarized Financial Statements over a 5-year time frame help provide better snapshots of financial performance. The Income Statement, Balance Sheet, and Cash Flow Statement are all provided.
Charts
Charts available including Profitability Margins (Gross Profit Margin, EBITDA Margin and Net Profit Margin), Revenue vs Direct Costs Projections, Revenue By Category and Cashflow Summary
DCF Valuation
We have included a Discounted Cash Flow (DCF) Valuation model showing the Business’s Net Present Value (NPV) based on a series of growth rates and assumptions. Weighted Average Cost of Capital Assumptions also provided including Risk Free rate, Beta, Risk Premium and Equity Risk Premium. A DCF valuation is a method used to estimate the value of an investment, business, or asset by discounting its expected future cash flows to present value. It is based on the principle that the value of an investment is determined by the present value of its future cash flows. The DCF valuation technique is widely used in finance, investment analysis, and corporate finance for making investment decisions, determining the fair value of securities, and evaluating the worth of businesses.
Depreciation Schedule
The Detailed Depreciation Schedule shows additions/disposals to the business’s Fixed Asset Register. Sections are included for Computer Equipment, Furniture and fittings, and Others.
Debt Schedule
Debt schedule provided with interest rate assumptions and payback period assumptions included.
Equity Schedule
Equity schedule provided with assumptions on all investments into the business by investors or owners.















Mark B –
Excellent model! Really easy to use and helped me with my forecasts.
Zhi Chen –
As a student starting out this has really helped understand how everything works. Model is well put together and I am using it for two of the businesses I’m studying
J.S. –
As a startup, we found this model perfect for our financial planning. It helped us clarify our projections