American Waterfall Distribution Model
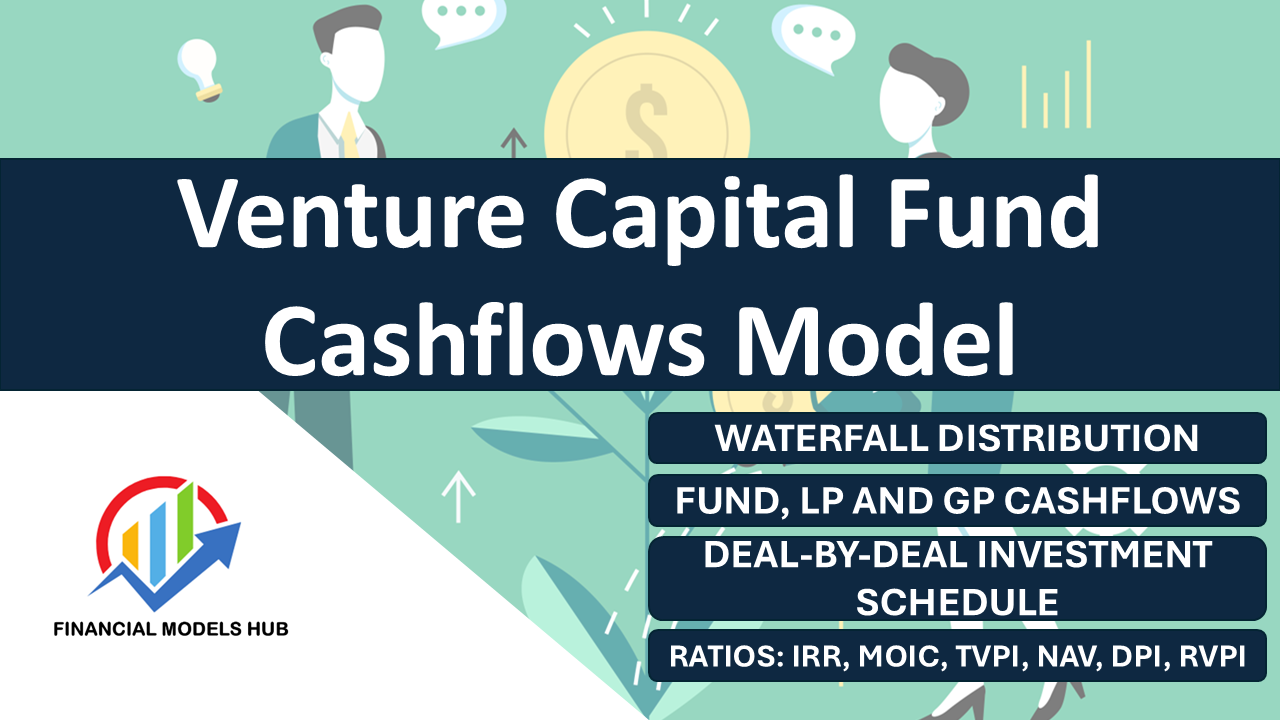
This Private Equity Fund Cashflows Model has been built for use by any Limited Partners (LPs) or General Partners (GPs) wanting to model their Private Equity Fund out over a 10 year period or anyone looking to understand how a Private Equity Fund operates and the investor cashflows that flow through.
We have purpose build this model with a detailed Assumptions page that lets the user input all the relevant Fund, Investor (LP), Investment Manager (GP) and Investment assumptions; and shows what the waterfall cashflow distribution looks like for the LPs and GPs. We offer both American Waterfall and European Waterfall distribution models depending on how your fund is set up. This particular model uses the American Waterfall distribution, however, we also sell a European Waterfall distribution model here: Private Equity Fund Cashflows Model (Investor Cashflows) – European Waterfall
Users will easily be able to navigate the model with all input fields highlighted in Blue font. These models are designed to be the perfect tool for LPs/GPs looking at testing out a wide variety of assumptions whether they are looking at starting a PE Fund; or even testing out how their current portfolio is tracking and likely distributions into the future.
This model can also be a perfect tool to give to external stakeholders that also want a snapshot of how the PE Fund is currently performing and what the forecasts look like.
Fund Assumptions
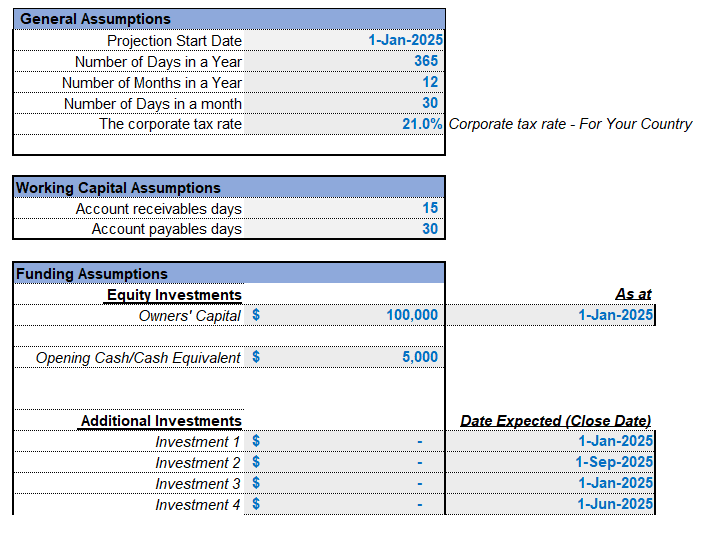
The model begins with a ‘Fund Assumptions’ input page where you have to input the following:
- Fund Start Date
- Fund Size (US$m) but can use any other currency
- Equity Component (% funds committed as a % of total fund)
- Debt Component (% funds committed as a % of total fund) along with interest rate and maturity (# of years).
- Commitment Period (# of Years) – The duration at which capital can be called. We have fixed this at 5 years (which allows for a 5 year exit period)
- Investment Period (# of Years) – Time frame for making new investments. We have fixed this at 5 years (which allows for a 5 year exit period)
- Fund Life / Term (# of Years) – Overall duration of the Fund. We have fixed this at 10 years (which is the life of most PE funds) and allows for an investment period of 5 years and exit period of 5 years
- Hurdle Rate or Preferred Returns Before Profit Sharing to LP – Minimum return (p.a.) that LPs most receive before GPs can start receiving carried interest.
- Discount rate
- Tax Rate
- Fund Fees & Fund Expenses – includes inputs on Set Up and One-off fund expenses as a % of the total funds committed, Recurring Annual fund expenses as a % of the total funds committed and Transaction fees as a % of Invested Capital
Investor (LP) and Investment Manager (GP) Assumptions
Investor (LP) and Investment Manager (GP) assumptions are critical for setting expectations and evaluating performance of the Private Equity Fund. We have included the main financial and operational aspects that influence both the fund’s structure and its anticipated returns. Specifically inputs have been included for:
- LP Component:
- LP Committed Contribution ($)
- LP Contribution Share % (as a % of the total fund contribution)
- Management Fees Paid during the Commitment Period (as a % of Committed Capital)
- Management Fees Paid during the Post-Commitment (Exit Period) as a % of Invested Capital
- Hurdle Rate or Preferred Returns Before Profit Sharing.
- GP Component
- GP Committed Contribution ($)
- GP Contribution Share % (as a % of total fund contribution)
- Carried Interest (Share of the fund’s profits to GPs)
- Catch-up Provision (after LPs have received their preferred return, this % allows GPs to catch up to agreed % of total profits including carried interest)(only for American Waterfall, not European Waterfall as we assume no Catch-up provision)
- Promote Structure
- After the hurdle rate and catch-up provisions are satisfied, LPs and GPs receive a % of remaining profits according to a promote structure split %.
Investment Assumptions and Capital Drawdown Schedule (Deal By Deal)
A Capital Drawdown Schedule has also been included showing each Year’s Capital Drawdown amount (as a % of the total fund capital) and the Equity and Debt % component. Each Year’s Draw Down amount is what is used for each Investment made in that relevant Year. We assume 1 investment per year.
From each Capital Drawdown for each Year, we take out Management Fees and Fund Expenses along with the Transaction Fees, before arriving at the Total Investment Amount or Invested Capital. The user is then able to input what the Holding Period is for each Investment (# of Years), the Dividend Paid p.a. from the investment and also the estimated/actual Exit Multiple.
Fund Cashflow Forecasts
The model includes a Detailed Year by Year breakdown of:
- Fund Capital Contribution (Equity, Debt, Total, Management Fees & Fund Expenses Drawn)
- Investments Made (Total Invested Capital, Transaction Fees, Investment Inflows (Dividends and Exit inflows), Investment Outflows (Debt repayment, Interest paid, Management Fees (Exit Period), Annual Fund Operational Expenses (Exit Period), Distributions Available post debt repayment
- LP and GP Cash Flow / Distributions Schedule showing Distributions pre-LP and GP Fees (Hurdle Rate, Catch Up, Carried Interest), Distributions post-LP and GP Fees
- Summary of Fund Returns showing the Funds Gross Return, Gross IRR and Gross MOIC as well as the Funds Net Return, Net IRR and Net MOIC.
Investments Schedule
The model includes a Detailed Year by Year breakdown of each Investment Deal broken down by Amount Invested, Cash Inflows (Dividend, Exit Inflows), Cash Outflows (Debt Repayment, Interest Paid, Exit Period Fees and Annual Operational Expenses.
Total Net Cashflow is also calculated together with a point in time Net Asset Value (NAV) calculation for the particular Investment.
Distribution breakdown on the particular Investment is then included showing the Total Available for Distributions to LPs and GPs pre-Return of Capital, Hurdle Rate, Catch Up provisions and Carried Interest; as well as post-Return of Capital, Hurdle Rate, Catch Up Provisions and Carried Interest.
A Summary of Investment Schedule then shows the totals which feed into the Fund Cashflow Forecast sheet and both the LP Schedue and GP Schedule sheets.
LP Schedule
The model includes a Detailed Year by Year breakdown of each Limited Partners (LP) Fund Capital Contribution, Management Fees, Investments, Debt Repayment, Distributions and Cash Flow relative to the LP contribution share %.
The LP cash flow / distribution schedule has taken into account the specific waterfall distribution of return of LP invested capital, LP preferred return/hurdle rate on exit less catch up provisions paid to the GP and Carried interest paid.
The Summary LP Returns breakdown then shows that the Gross IRR and Gross MOIC is for LPs, as well as the Net IRR and Net MOIC for LPs.
GP Schedule
The model includes a Detailed Year by Year breakdown of each General Partners (LP) Fund Capital Contribution, Investments, Debt Repayment, Distributions and Cash Flow relative to the GP contribution share %.
The GP cash flow / distribution schedule has taken into account the specific waterfall distribution of return of GP invested capital, GP catch up provisions earned and GP Carried interest earned. Management Fees Received is also accounted for to give a total GP net distribution amount.
The Summary GP Returns breakdown then shows that the Gross IRR and Gross MOIC is for GPs, as well as the Net IRR and Net MOIC for GPs.
Debt Schedule
The model includes a Year by Year Debt Schedule showing the amount of Debt Capital drawn down (if any – user is able to input whether Debt is used at the Fund level in the ‘Fund Assumptions’ sheet). Interest Paid and Debt Repayment amounts are also driven of the Fund Assumptions sheet showing debt interest rate % and maturity period.
PE Fund Ratios
We have included the main PE Fund ratios used for decision making including:
- Fund NAV: gives an indication of the fund’s current value and can be used to assess the value of an investor’s stake in the fund. It reflects the value of remaining portfolio investments at a given point in time.
- Multiple On Invested Capital (MOIC): provides a measure of how much value the fund has generated relative to the capital invested. A MOIC of 2.0 means that for every dollar invested, two dollars have been returned.
- Total Value To Paid-In Capital (TVPI): reflects the overall performance of the fund, including both realized returns and the value of unrealized investments. A TVPI of 2.0 means that the fund’s total value is twice the amount of capital invested.
- Residual Value To Paid-In Capital (RVPI): assesses the current value of the remaining investments in a fund relative to the capital that has been contributed by investors
- Distributed To Paid-In Capital (DPI): shows how much of the invested capital has been returned to investors. A DPI of 1.0 means that investors have received back their full invested capital. Values above 1.0 indicate that investors have received more than their invested capital.
- Gross IRR: measures the performance of the fund’s investments before any fees or expenses. It shows the raw return on investments
- Net IRR: measures the performance of the fund after accounting for management fees, carried interest, and other costs. It shows the actual return to investors
Charts
We have included Charts on Private Equity Fund Metrics Analysis (showing MOIC, TVPI, RVPI, DPI, Gross IRR and Net IRR), Fund Contributions v Distributions and MOIC and TVPI vs Total Value Of Fund.













Lucas –
I’ve been through a few models and this is by far the best one out there. Really easy to follow.
Ethan –
This saved me hours of trying to build an LP/GP waterfall from scratch
SLee –
This is an excellent model showing how the Private Equity Waterfall distribution is for both LPs and GPs. I used this for our own PE fund and was able to clearly see where the flow of investment capital went once exits were realized. Very nicely put together and easy to follow too.
Martin K –
Love this model, its been great for walking investors through distribution timing and priority. In our data room as we speak!
Joanna M –
Really nice model. Everything from preferred return to final split was clearly laid out
Leo F –
Highly recommend for anyone starting out a fund! This helped me understand distribution mechanics for our first fund
Carmen –
Hands down the BEST private equity fund cash flow model out there. And also the best priced too! Others i’ve seen are too complex and you can’t follow easily. This is perfectly structured.
Jasmine L –
Very nice model. Makes modeling preferred returns and catch-up tiers super straightforward
Sean R –
Excellent model! As a first-time fund manager, this gave me exactly what I needed to model investor cashflows
Greg –
Excellent European Waterfall model. Very easy to follow
Robert T –
A clean and accurate waterfall model I can easily follow!
George B –
If you’re raising a fund and need to show cashflows, this is the model to use. You will save yourself alot of time and alot of money hiring someone to build this for you
Andre V –
Way better than some of the over-engineered models floating around! really easy to follow and understand
Phil –
Fantastic model ! We have used this for our PE fund and it has proven a huge time saver for us. Thank you again !